

 Rapid Ext JS (beta)


RootCause – Next Generation Error Handling For Web Apps
April 11, 2017
128 Views
Guest Blog Post
Error reports from end users are something most of us developers have to deal with. The process of collecting enough information to reproduce a bug is quite tedious and the turnaround time from an end user bug report to a delivered bug fix is usually long. This is something we have experienced a lot at Bryntum, and we decided to try to do something about it.
At SenchaCon 2016 in Las Vegas, I demonstrated an early prototype of a tool which has now matured into a full blown service for monitoring and reproducing errors in web applications. Before describing our new service, let’s first look a bit at debugging and productivity.
Developer Debugging Productivity
As developers, we face bug reports with widely varying quality and content. The time it takes for a developer to reproduce and fix a bug is usually proportional to the quality of the bug report. The worst bug report is one that just says “Feature X doesn’t work.” Developers are then left with no clue of exactly how it “doesn’t work” and under what circumstances. Investigating such a bug report takes lots of time and resources. It involves contacting the user to collect a step-by-step description, trying to reproduce the issue, and finally fixing it.
A slightly better bug report contains steps to reproduce the problem and maybe a screenshot. This usually means the user can consistently reproduce the issue, which is a good start. But it does not mean that the developer will be able to reproduce it – the works on my machine effect. Because of this, such bug reports also require a few rounds of communication with the user which consumes time.
The best bug report will contain the minimum set of steps needed to reproduce the bug and the call stack of the exception. Call stacks are very useful, because they point to the place in the code that threw the exception. But sometimes it’s just not enough, consider this callstack (a real crash report logged in our RootCause account):

Despite pointing to the originating code line for the exception, the call stack does not reveal the root cause of the bug, which is some broken logic in other non-throwing code. At Bryntum, we have been thinking long and hard about how to improve the quality of bug reports and what the ideal bug report should look like.
The Ideal Bug Report
So what is an ideal bug report? Obviously for developers, an ideal bug report is a failing unit test. Such a test would contain all the steps for reproducing the bug. Plus, the developer can pause a debugger when the exception is thrown, and examine all the internal state of the code that led to the problem (the “live” callstack).
This examination of the internal variables is very important, as it provides debugging “context” for the developer. After the developer is able to nail down the problem in the browser debugger, the bug is usually solved in a few minutes (assuming it’s something simple), or at least the bug fixing process becomes straightforward as everything is clear once the issue can be reproduced. Next question – how do we teach end users to submit ideal bug reports in the form of failing unit tests? Thankfully we do not have to, because RootCause solves this problem for us.
RootCause – Making Crystal Clear Bug Reports a Reality
RootCause records the user actions performed on the web page and creates a reproducible scenario from them. The scenario is analog to a test case and can be replayed by a developer. Together with the “pause on exception” option in the debugger, the developer can fast forward to being “in context.”
Compared to normal web debugging, when all you have is a textual presentation of the call stack in a bug report, debugging becomes so much faster and easier. You have the error reproduced as a “live,” crashed breakpoint in your browser. You can examine the internal variable and find the real root cause of the bug in minutes.
RootCause consists of three main parts:
- A JavaScript logger script responsible for the monitoring
- The Dashboard showing the errors reported in your applications
- The Replay Studio where you can replay the error session
Setting Up the Logger Client in 5 Minutes
To get started with monitoring your web app, add the RootCause logger script to your page and configure it according to your needs:
When the snippet above is executed, RootCause starts listening for the window error event. If configured with recordUserActions enabled, the logger will also record user interactions such as mouse move/click and keyboard typing. Additionally, it can also log Ajax traffic, console messages, and other interesting events that are helpful when debugging.
RootCause provides a number of ways to respect the user’s privacy and security. For example, a confirmation dialog can be shown to the end user, to get his or her approval before logging the error. The documentation contains a more detailed step-by-step guide on getting started, along with all the configuration options available.
When an unhandled error occurs, this information is sent over a secure HTTPS connection to the RootCause server (or to your private server for an on-premises installation). You will be notified immediately via Slack, or you can choose to receive a summary email report at any interval from minutes to days.
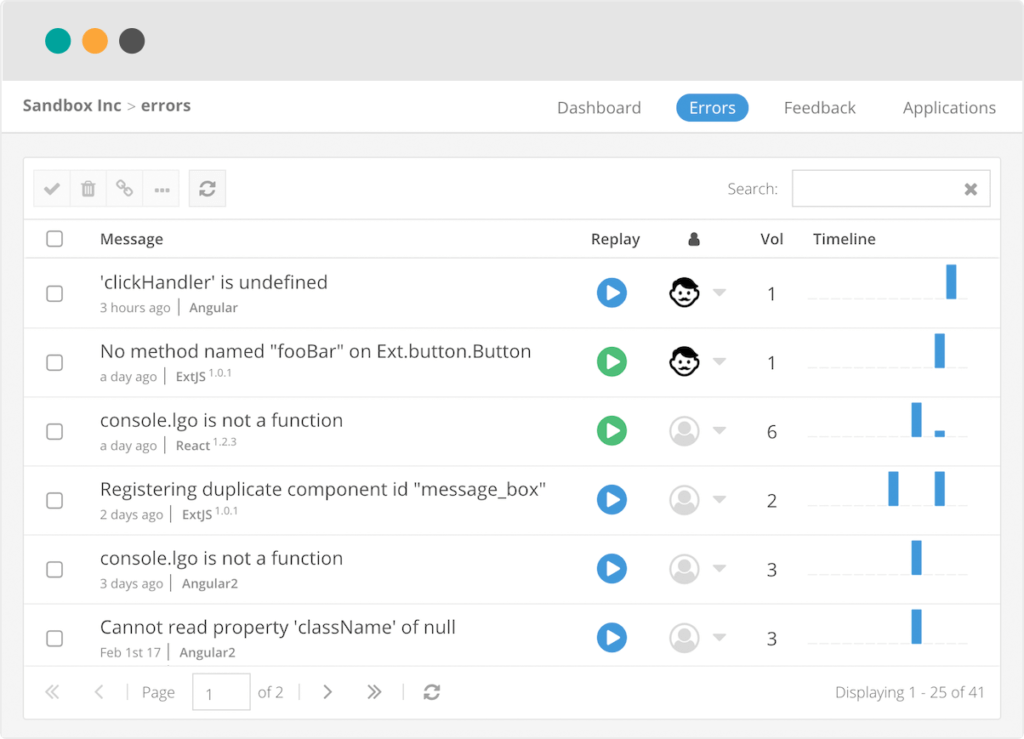
The RootCause Dashboard Application
In the RootCause dashboard application, you get a searchable list of all error reports along with occurrence trend charts and recent team activity.
Opening an error shows you a lot of useful debugging details such as OS, browser, timezone, language, user information, and custom tags.
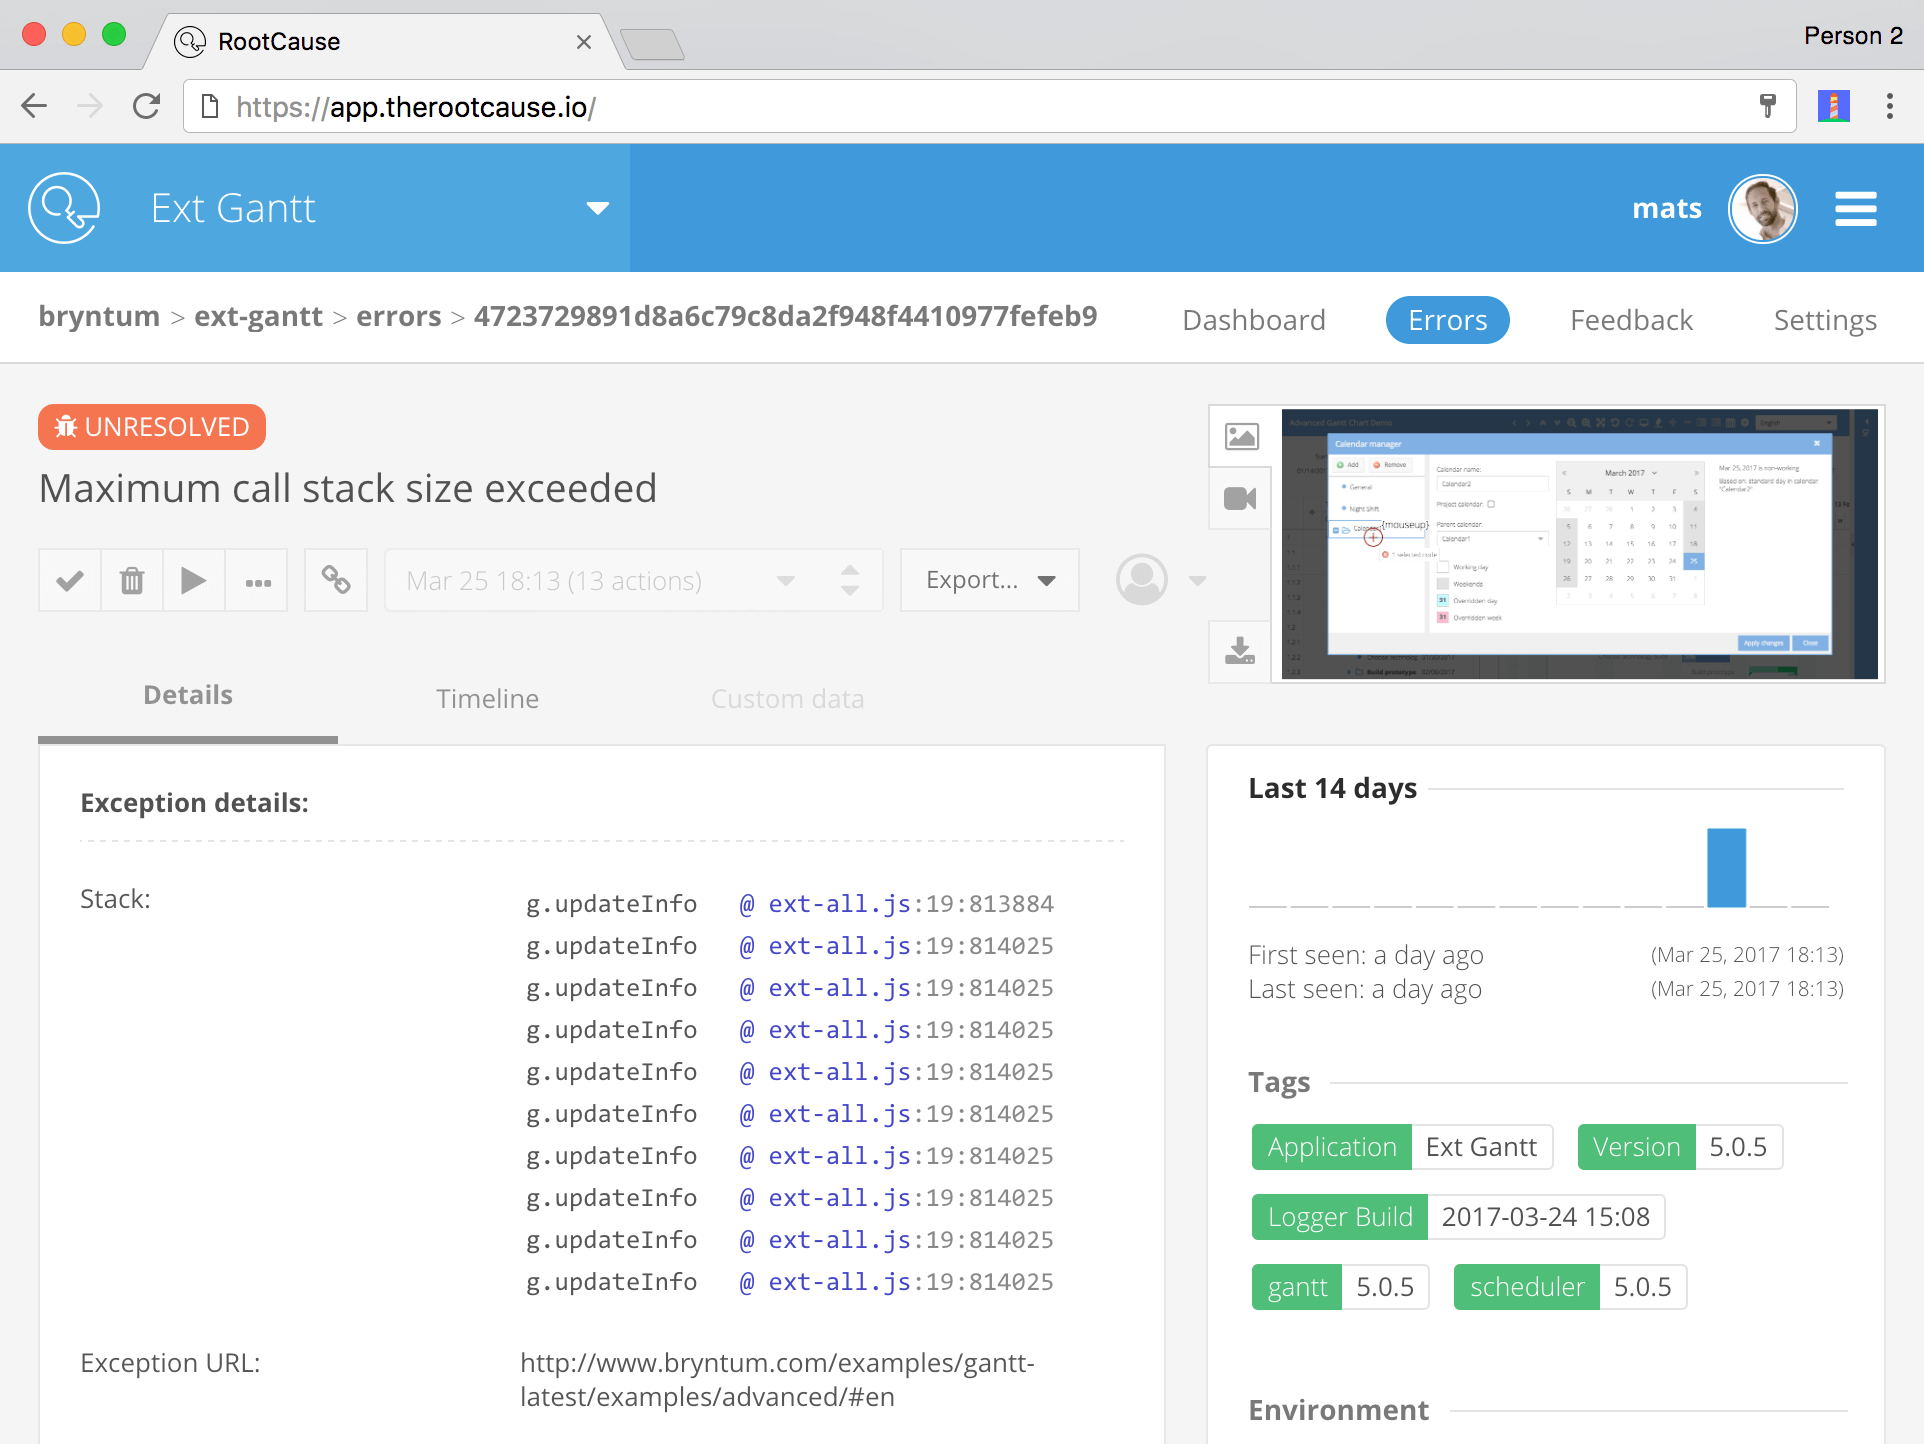
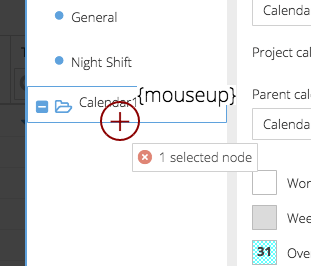
But perhaps the most interesting piece of debugging context is the screenshot showing how the application looked when it crashed. In the screenshot, we also show the last user interaction, which is likely what triggered the error.
Replaying a User Session
The details page has a play button, which opens the session in the Replay Studio. This is a unique and powerful feature of RootCause, where you can replay a user session to fully reproduce the bug in your own browser. You avoid the tedious time-consuming work of discovering and performing the step-by-step sequence yourself.
Simply open the developer console, enable Pause on exceptions and hit play. When the error is reproduced, you’ll have a live breakpoint, and you can debug the error with ease.
Collecting Manual User Feedback
Reporting JavaScript exceptions can be quite easily automated, but there are other sources of bugs and things that annoy end users. It’s not possible to automatically detect CSS bugs, layout/design bugs, or simply bad application UX. For example, here is a simple HTML button with a set fixed width and text that is too long to fit.
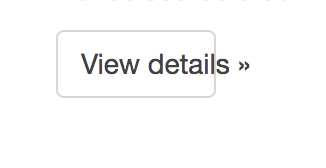
For these cases, we have added a Feedback button to get valuable feedback from the end user.
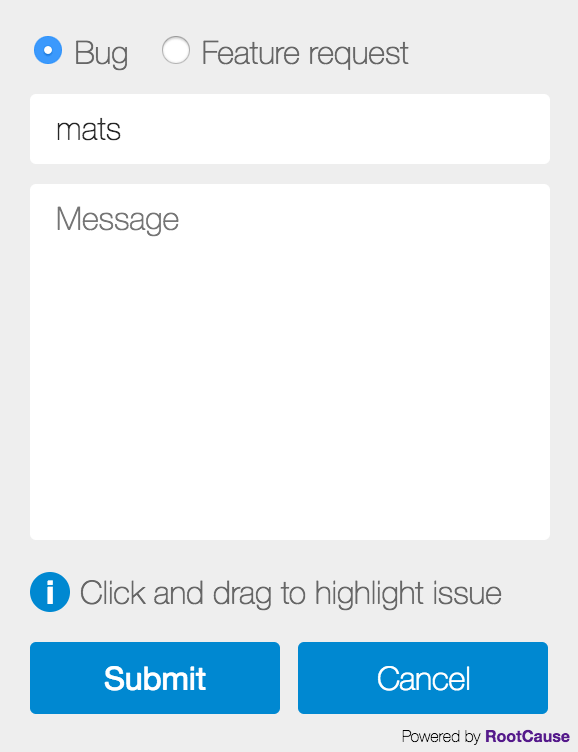
This feedback report lets the user highlight an area on the page and send their name and a message to your RootCause dashboard. With this information, it’s very clear to the developer what part of the app the user is referring to.
Benefits of Using RootCause
We’ve been using this tool for the past six months, and we’ve identified three main benefits:
1. Free testing help
On our Bryntum website, we showcase all of our JavaScript UI components, such as Gantt charts and Kanban boards. We have RootCause enabled on our online examples, so if visitors encounter an error on our site, they unknowingly help us improve our products. We get a clear and runnable test case with zero time or effort spent.
2. Automating feedback reports from end users
Gathering feedback using feedback buttons has been popular for a long time. RootCause can be configured to show a customizable feedback button to easily collect visual, CSS, UX bug reports, or feature requests. Having a screenshot generated automatically along with a user message is so much faster than forcing the user to manually capture a screenshot and attach it to an email or a ticket in a bug tracker.
3. Automating Developer/QA communication
If you have manual testers testing your application, RootCause will cut a lot of tedious manual reporting work. When a tester encounters an exception, it’s automatically logged and the status of the bug is shown immediately to the tester (New/Reproduced/Fixed). No need to capture screenshots manually and attach to a ticket.
Oceans of Time Saved
By using this tool at Bryntum, we’ve moved from a slow end user bug reporting cycle to a very fast cycle with almost no need for manual communication. We can reproduce bugs in a few minutes after we receive an automated bug report. If the fix is simple, we can go from bug report to updated production site in less than an hour, which is something our customers enjoy very much.
If you’re ready to try a new way of debugging, head over to https://therootcause.io and sign up for free. We offer several different plans, ranging from a free Hobbyist plan to an Enterprise plan with additional features. There is also an on-premises installation package available. If you’re interested, please contact us for details.
Happy bug hunting!
What's your reaction?
 0
0

 0
0

Latest Content

Ext JS Performance Optimization for Large-scale Applications
Are you facing issues with Ext JS applications’ performance as they scale up? Don’t worry!…
April 23, 2024

Ext JS Dynamic Forms: Hands-On Guide to Create Data Forms
Dynamic forms are changing the online world these days. ExtJS can help you integrate such…
April 23, 2024

How to Write Unit Tests with Sencha Test
In modern software development, unit testing has become an essential practice to ensure the quality…
April 22, 2024


