



 Ask Sencha AI
Configuration and Customization Options in Ext JS Pivot Grid
July 14, 2020
2688 Views
Get a summary of this article:
Pivot Grids are powerful tools to represent data and extract valuable insights from it. In the last post we looked at the 5 powerful features of the Ext JS Pivot Grid. In this blog post we demonstrate Pivot Grid Configuration and Customization examples you can directly use into your application.
Pivot Grid Configuration
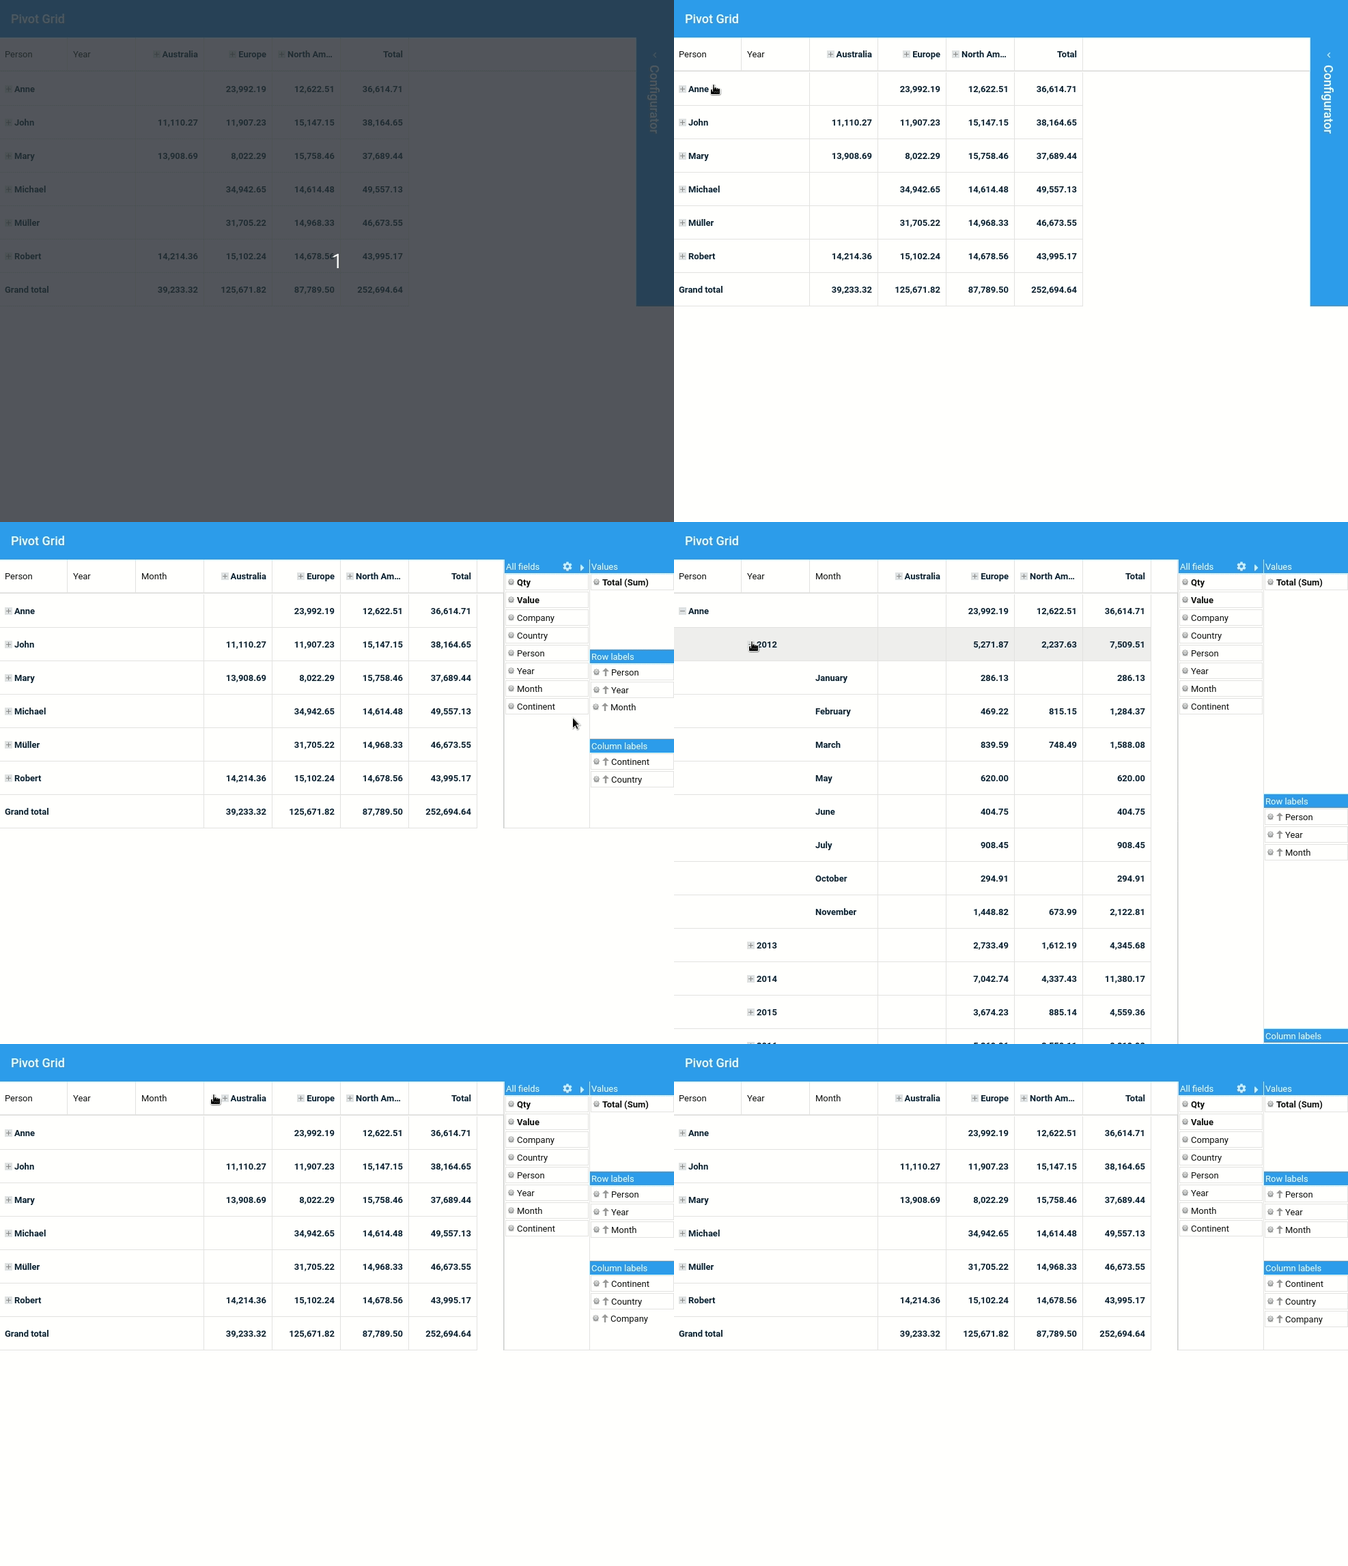
How to:
plugins: {
	pivotconfigurator: {
    	id: 'configurator',
    	// It is possible to configure a list of fields that can be used to
    	// configure the pivot grid
    	// If no fields list is supplied then all fields from the Store model
    	// are fetched automatically
    	fields: [{
            dataIndex: 'quantity',
            header: 'Qty',
            // You can even provide a default aggregator function to be used
            // when this field is dropped
            // on the agg dimensions
            aggregator: 'min',
            formatter: 'number("0")',

            settings: {
                // Define here in which areas this field could be used
                allowed: ['aggregate'],
                // Set a custom style for this field to inform the user that
                // it can be dragged only to "Values"
                style: {
                    fontWeight: 'bold'
                },
                // Define here custom formatters that ca be used on this dimension
                formatters: {
                    '0': 'number("0")',
                    '0%': 'number("0%")'
                }
            }
    	}, {
            dataIndex: 'value',
            header: 'Value',

            settings: {
                // Define here in which areas this field could be used
                allowed: 'aggregate',
                // Define here what aggregator functions can be used when this
                // field is used as an aggregate dimension
                aggregators: ['sum', 'avg', 'count'],
                // Set a custom style for this field to inform the user that it
                // can be dragged only to "Values"
                style: {
                    fontWeight: 'bold'
                },
                // Define here custom renderers that can be used on this dimension
                renderers: {
                    'Colored 0,000.00': 'coloredRenderer'
                },
                // Define here custom formatters that ca be used on this dimension
                formatters: {
                    '0': 'number("0")',
                    '0.00': 'number("0.00")',
                    '0,000.00': 'number("0,000.00")',
                    '0%': 'number("0%")',
                    '0.00%': 'number("0.00%")'
                }
            }
    	}, {
            dataIndex: 'company',
            header: 'Company',

            settings: {
                // Define here what aggregator functions can be used when this
                // field is used as an aggregate dimension
                aggregators: ['count']
            }
    	}, {
            dataIndex: 'country',
            header: 'Country',

            settings: {
                // Define here what aggregator functions can be used when this
                // field is used as an aggregate dimension
                aggregators: ['count']
            }
    	}, {
            dataIndex: 'person',
            header: 'Person',

            settings: {
                // Define here what aggregator functions can be used when this
                // field is used as an aggregate dimension
                aggregators: 'count'
            }
    	}, {
            dataIndex: 'year',
            header: 'Year',

            settings: {
                // Define here the areas in which this field is fixed and cannot
                // be moved from
                fixed: ['topAxis']
            }
    	}, {
            dataIndex: 'month',
            header: 'Month',
            labelRenderer: 'monthLabelRenderer',

            settings: {
                // Define here what aggregator functions can be used when this
                // field is used as an aggregate dimension
                aggregators: ['count'],
                // Define here in which areas this field could be used
                allowed: ['leftAxis', 'topAxis']
            }
    	}]
	}
}
Sencha Fiddle:
Pivot Grid Customizations
Ext JS Pivot Grid provides many customization options.
How to :
	matrix: {
        //Define "compact" layout
        viewLayoutType: 'compact',
        compactViewColumnWidth: 250,
        textRowLabels: 'Row labels',
        //First column is a grand total
        colGrandTotalsPosition: 'first',
        store: {
            type: 'sales'
        },
        aggregate: [{
            dataIndex: 'value',
            header: 'Total',
            aggregator: 'sum',
            renderer: function (value, meta, record) {
                //Add CSS background
                if (value > 40000) {
                    meta.style = "background-color: green;";
                }

               if (value != null && value < 10000) {
                    meta.style = "background-color: red;";
                }

                return Ext.util.Format.number(value, '0,000.00');

            }
        }],
        leftAxis: [{
            dataIndex: 'person',
            header: 'Person'
        }, {
            dataIndex: 'year',
            header: 'Year'
        }],
        topAxis: [{
            dataIndex: 'continent',
            header: 'Continent'
        }, {
            dataIndex: 'country',
            header: 'Country'
        }]
    }
Sencha Fiddle:
More Plugins
More pivot grid plugins such as Cell Editing and Exporter are also available. View detailed documentation.
Build Your Pivot Grid with Ext JS 7.2
The free 30-day trial of Ext JS 7.2 provides full access to the product features. Get started today and see how you can build a powerful pivot grid to make insights from data more apparent.


Latest Content

Building Responsive, Data-Driven Enterprise Applications with JavaScript
In enterprise software, responsiveness is no longer a nice-to-have. Users expect the same application to…
August 11, 2026

What’s New in ReExt 1.2
Modern teams are under constant pressure to ship faster without sacrificing UX quality, maintainability, or…
August 11, 2026

BFF Architecture - Optimizing Communication between Node. js and Ext JS
Modern enterprise applications rarely struggle because they lack features. More often, they struggle because the…
August 11, 2026