


 Ask Sencha AI
Visualizing Geospatial Data using Ext JS and Google Maps
January 9, 2020
4537 Views
Get a summary of this article:
When it comes to working with geospatial data (i.e. data that has location information associated with it) you often need a good way to visualize the data in your business application for it to be useful.
Ext JS includes a “ux” package containing various user extensions (including one for Google Maps) that allows you to easily incorporate a rich map in to your Ext JS app along with built-in functionality to automatically add markers to the map based on data contained within an Ext JS Store.
This blog post shows a simple application built with Ext JS 7.0 Modern Toolkit that includes a grid and a map to show the location of customers. This app will be designed to work on both mobile devices and desktop computers.
The grid and map will both connect to the same data source—a sample dataset with customer names, addresses, latitude/longitude coordinates, and the number of software licenses they own. The sample app’s complete source code is available on Github and a working version of the app is available here.
Download the Javascript Web Framework and take advantage of its 30-day free trial! It will greatly assist you in developing applications that visualize geospatial data!
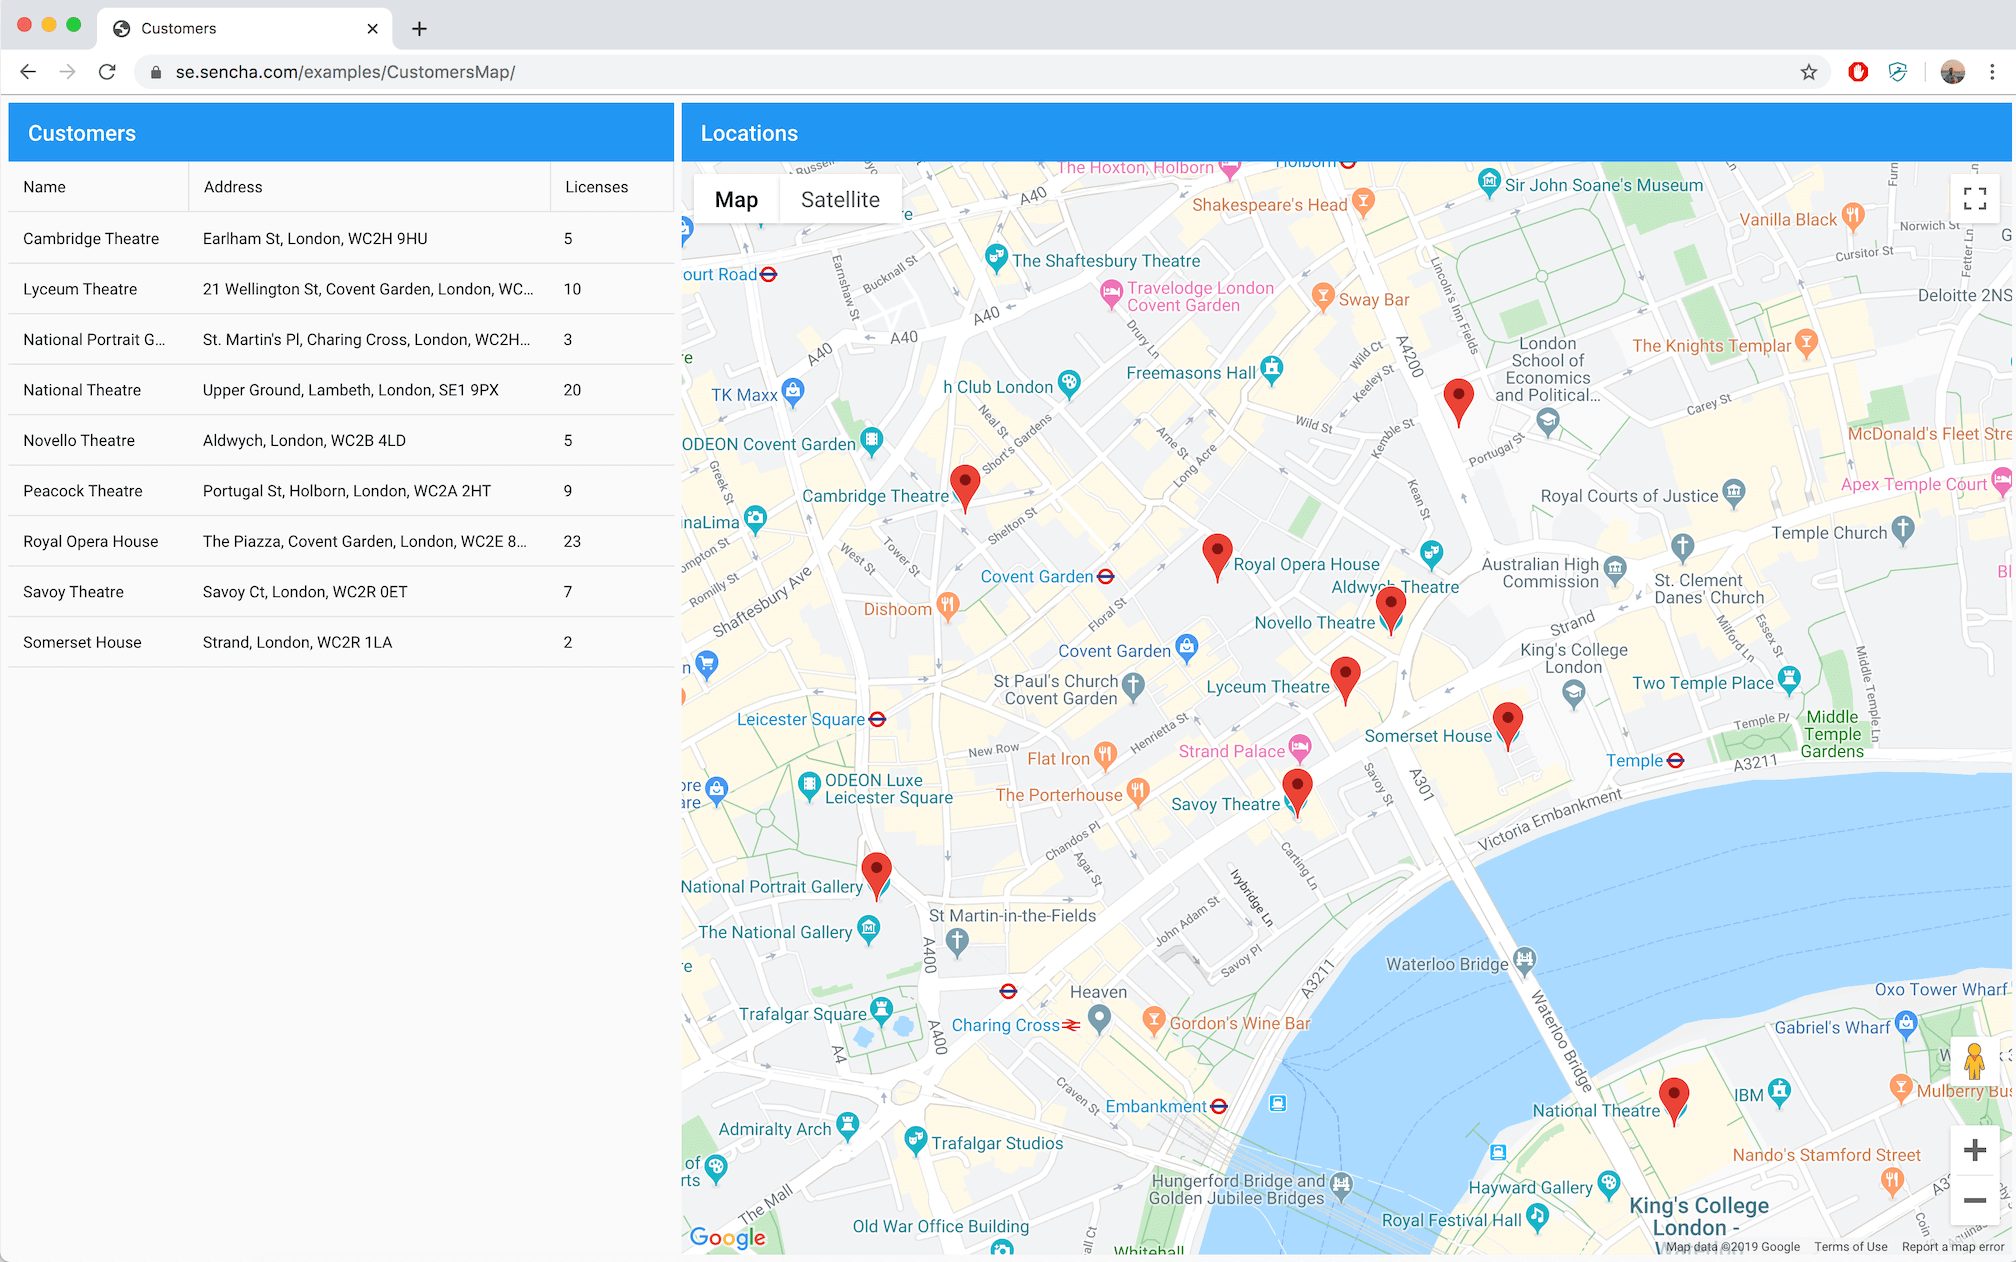
The application running on a desktop web browser
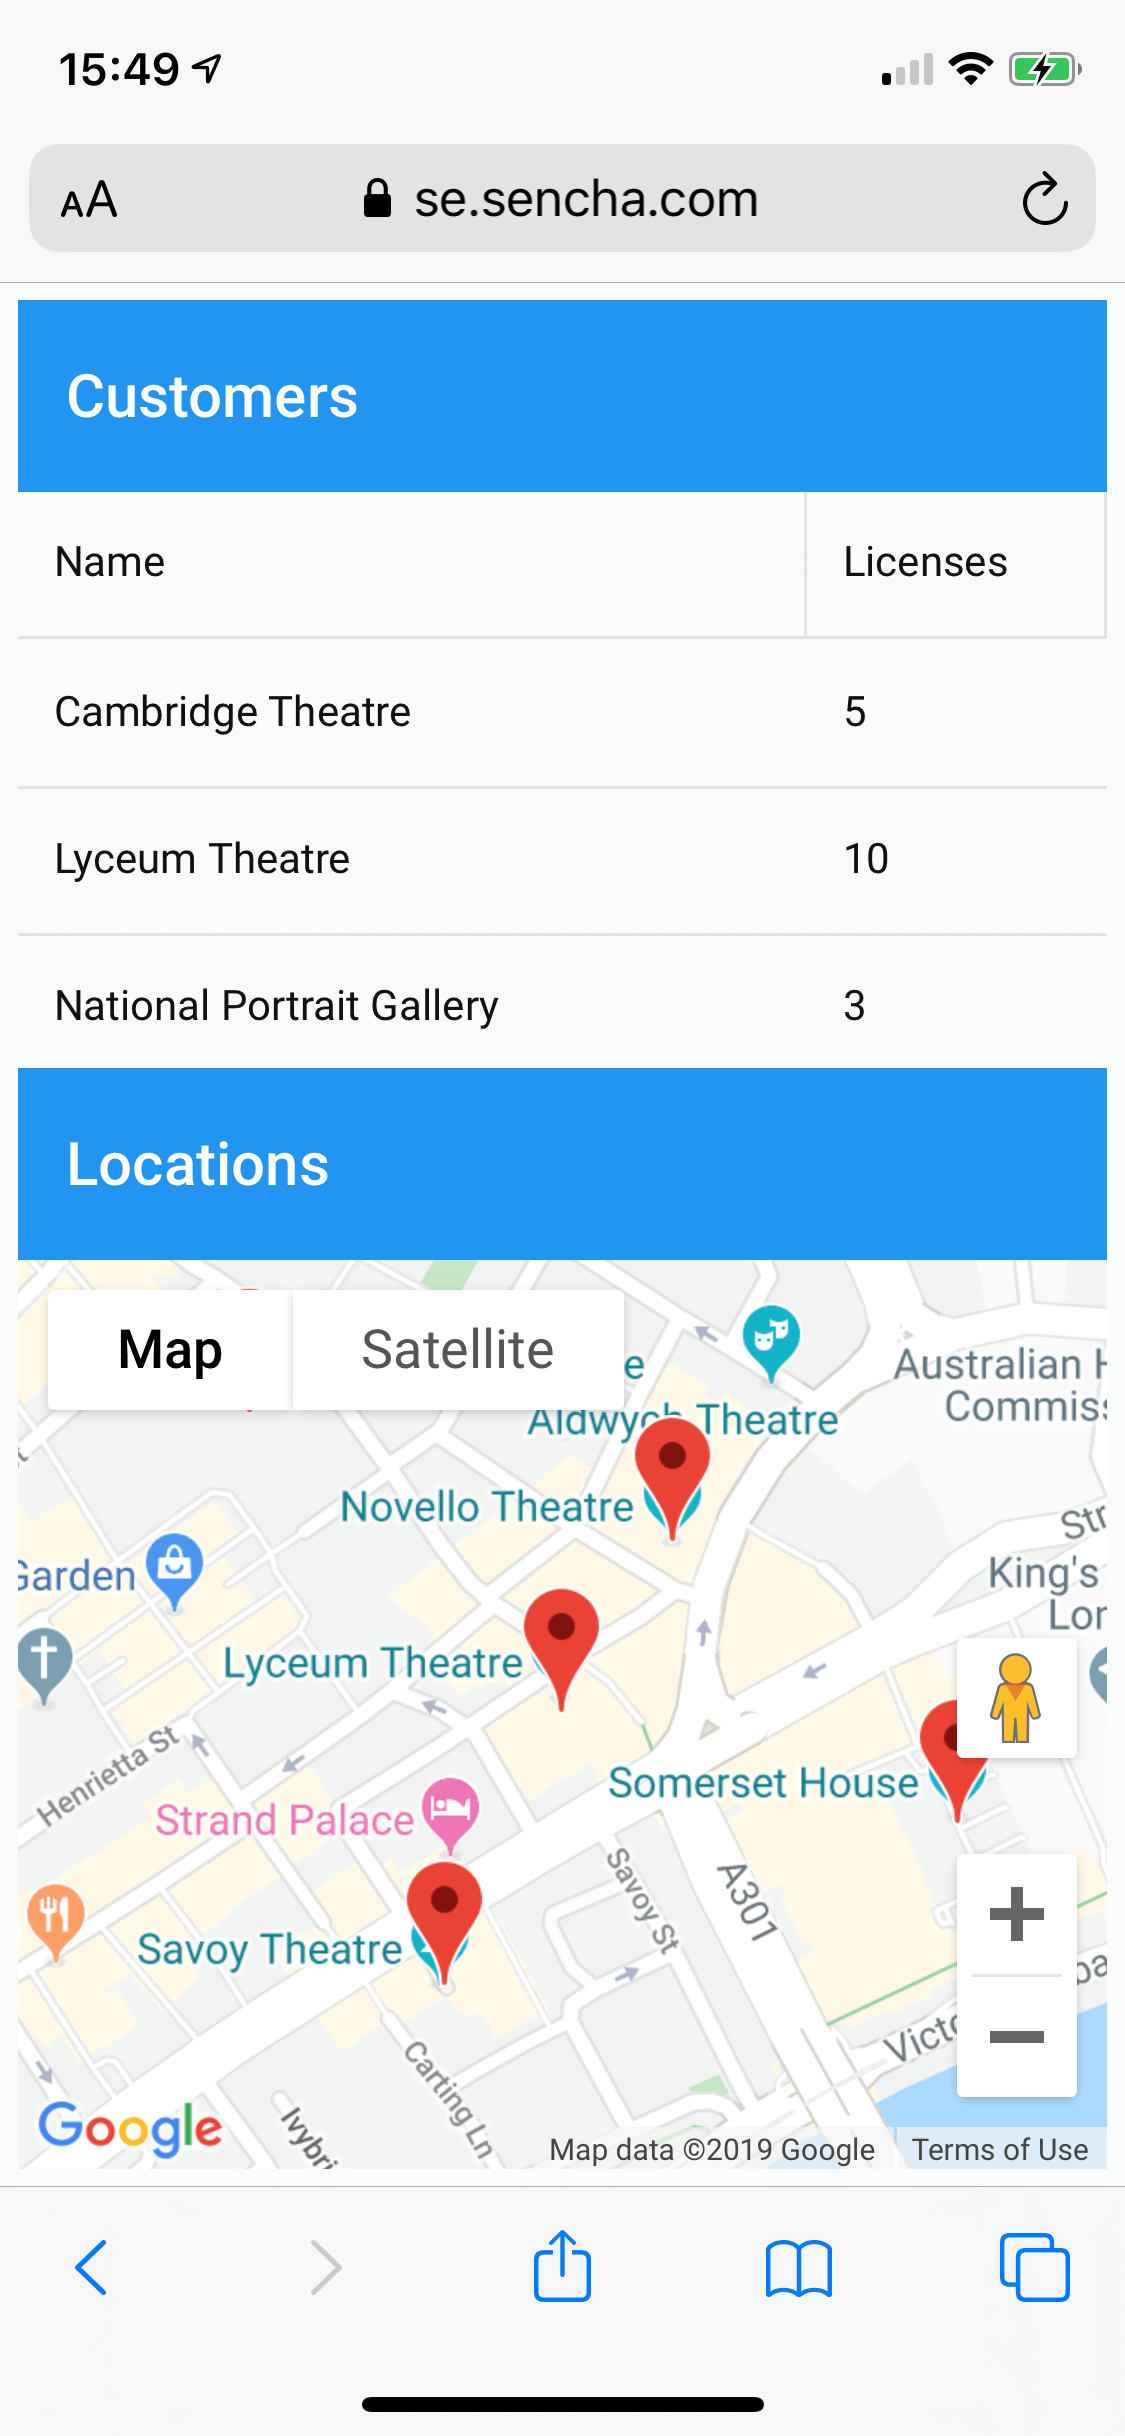
The same application running on an iPhone
Initial Steps
To create this app, start off by creating a blank Ext JS application. For this example, I used Ext JS 7.0 Modern Toolkit.
For Google Maps to render correctly within your app, you will need to generate a Google Maps API key via the Google Cloud Platform Console as described here. This API key gets associated to one or more URLs where your app is running and allows the custom maps to render without a “Google Maps API is required” error message.
Once you have generated your API key via the Google Cloud Platform Console and associated a permitted URL with it (for example http://localhost:1841), open your app.json file and add the following to the root of the file, making sure to insert your own API key:
"mashup": {
    "map": {
        "options": "?key=your_key_here"
    }
},
Ext JS will append this key (along with any other query string parameters you specify) to the request when loading the Google Maps JavaScript API.
While you have the app.json file open, you will also need to add the ux and google packages to the requires array:
"requires": [
    "font-awesome",
    "ux",
    "google"
],
Creating the Model and Main View
The data model for this app is a simple structure, with name, address, latitude and longitude coordinates, and a field holding the number of licenses held by the customer:
Ext.define('MyApp.model.Customer', {
    extend: 'Ext.data.Model',

    fields: [{
        name: 'name'
    }, {
        name: 'address'
    }, {
        name: 'lat',
        format: 'double'
    }, {
        name: 'lng',
        format: 'double'
    }, {
        name: 'licenses',
        format: 'integer'
    }]
});
The code for the main view will combine the grid and map views (both of these are created in the next section).
Ext.define('MyApp.view.main.Main', {
    extend: 'Ext.Container',
    xtype: 'app-main',

    controller: 'main',
    viewModel: 'main',

    platformConfig: {
        desktop: {
            layout: 'hbox'
        },
        '!desktop': {
            layout: 'vbox'
        }
    },

    padding: 6,

    items: [{
        xtype: 'customergrid',
        reference: 'customergrid',
        flex: 1,
        platformConfig: {
            desktop: {
                margin: '0px 6px 0px 0px',
                minWidth: 350
            },
            '!desktop': {
                margin: '0px 0px 6px 0px',
                minHeight: 250
            }
        }
    }, {
        xtype: 'customermap',
        reference: 'customermap',
        flex: 2
    }]
});
This view is rendered with the grid and map positioned next to each other horizontally by using an hbox layout. This won’t look great on a phone though, due to the narrow screen, so we can dynamically change the layout based on the platform type, and switch to using a vbox layout if not using a desktop device by specifying the following platformConfig on the Main view.
platformConfig: {
    desktop: {
        layout: 'hbox'
    },
    '!desktop': {
        layout: 'vbox'
    }
},
This configuration will position the grid above the map using a vbox layout, making better use of the available space without having to define completely separate views (one for desktop and another for phone). You could perfect this further by adding additional rules based on screen size or screen orientation.
The main view also has a View Model associated with it, containing the configuration of the Customers Store and some sample hardcoded data:
Ext.define('MyApp.view.main.MainModel', {
    extend: 'Ext.app.ViewModel',

    alias: 'viewmodel.main',

    stores: {
        customers: {
            model: 'MyApp.model.Customer',
            sorters: 'name',
            data: [{
                name: 'Royal Opera House',
                address: 'The Piazza, Covent Garden, London, WC2E 8HD',
                licenses: 23,
                lat: 51.512912,
                lng: -0.122204
            }, {
                name: 'Lyceum Theatre',
                address: '21 Wellington St, Covent Garden, London, WC2E 7RQ',
                licenses: 10,
                lat: 51.511580,
                lng: -0.119976
            }, {
                name: 'Novello Theatre',
                address: 'Aldwych, London, WC2B 4LD',
                licenses: 5,
                lat: 51.512331,
                lng: -0.119183
            }, {
                name: 'Peacock Theatre',
                address: 'Portugal St, Holborn, London, WC2A 2HT',
                licenses: 9,
                lat: 51.514594,
                lng: -0.118002
            }, {
                name: 'Somerset House',
                address: 'Strand, London, WC2R 1LA',
                licenses: 2,
                lat: 51.511075,
                lng: -0.117144
            }, {
                name: 'Savoy Theatre',
                address: 'Savoy Ct, London, WC2R 0ET',
                licenses: 7,
                lat: 51.510353,
                lng: -0.120804
            }, {
                name: 'National Portrait Gallery',
                address: 'St. Martin\'s Pl, Charing Cross, London, WC2H 0HE',
                licenses: 3,
                lat: 51.509445,
                lng: -0.128143
            }, {
                name: 'National Theatre',
                address: 'Upper Ground, Lambeth, London, SE1 9PX',
                licenses: 20,
                lat: 51.507010,
                lng: -0.114232
            }, {
                name: 'Cambridge Theatre',
                address: 'Earlham St, London, WC2H 9HU',
                licenses: 5,
                lat: 51.513656,
                lng: -0.126594
            }]
        }
    }
});
Creating the Map View
To add a map to the application, we can create a new view in the app using the code below. The markers config is bound to the Customers Store that’s defined on the main View Model. When the Store is loaded with data, markers will automatically be added to the map based on the field mappings defined within markerTemplate.
We can also define a latitude and longitude to center the map when it initially renders and specify a default zoom level.
Ext.define('MyApp.view.map.CustomerMap', {
    extend: 'Ext.Panel',
    xtype: 'customermap',

    controller: 'customermap',

    requires: [
        'Ext.ux.google.Map'
    ],

    title: 'Locations',
    layout: 'fit',

    items: [{
        xtype: 'map',
        mapOptions: {
            center: {
                latitude: 51.511580,
                longitude: -0.119976
            },
            zoom: 16
        },
        bind: {
            markers: '{customers}'
        },
        markerTemplate: {
            title: '{name}',
            position: {
                lat: '{lat}',
                lng: '{lng}'
            }
        },
        listeners: {
            markerclick: 'onMarkerClick'
        }
    }]
});
When markers are clicked, I’ve added logic that will animate the selected marker, and also select and scroll to the record in the grid (see the next section for the grid code). The Controller for the Map view looks like this:
Ext.define('MyApp.view.map.CustomerMapController', {
    extend: 'Ext.app.ViewController',

    alias: 'controller.customermap',

    onMarkerClick: function(map, info) {
        var me = this,
            view = me.getView(),
            grid = view.up('app-main').down('customergrid'),
            marker = info.marker,
            record = info.record;

        me.animateMarker(marker);

        grid.scrollToRecord(record);
        grid.getSelectable().selectRows(record, false, true);
    },

    animateMarker: function(marker) {
        var me = this;

        marker.setAnimation(google.maps.Animation.BOUNCE);

        // Clear the animation on the marker after 1.4 seconds
        Ext.defer(me.clearMarkerAnimation, 1400, me, [marker]);
    },

    clearMarkerAnimation: function(marker) {
        marker.setAnimation(null);
    }
});
Creating the Grid View
The grid also binds to the same Customers Store defined on the main View Model. I added a platformConfig to the address column with hidden set to true, so if the app is loaded on a smaller screen device it won’t show the address column by default. This makes the grid more presentable on smaller screen devices like phones. See code below for the grid view.
Ext.define('MyApp.view.grid.CustomerGrid', {
    extend: 'Ext.grid.Grid',
    xtype: 'customergrid',

    controller: 'customergrid',

    title: 'Customers',
    bind: '{customers}',

    columns: [{
        text: 'Name',
        dataIndex: 'name',
        flex: 1
    }, {
        text: 'Address',
        dataIndex: 'address',
        minWidth: 200,
        flex: 2,
        platformConfig: {
            '!desktop': {
                hidden: true
            }
        }
    }, {
        text: 'Licenses',
        dataIndex: 'licenses',
        width: 100
    }],

    listeners: {
        selectionchange: 'onSelectionChange'
    }
});
The View Controller code is shown below. When a user selects a row in the grid, the associated marker is located and centered on the map and briefly animated.
Ext.define('MyApp.view.map.CustomerGridController', {
    extend: 'Ext.app.ViewController',

    alias: 'controller.customergrid',

    onSelectionChange: function(grid, selection) {
        var me = this,
            view = me.getView(),
            record = selection[0],
            customerMap = view.up('app-main').down('customermap'),
            mapController = customerMap.getController(),
            gmap = customerMap.down('map'),
            marker = gmap.getMarkerForRecord(record);

        gmap.setMapCenter(record);

        mapController.animateMarker(marker);
    }
});
Now, as a last step, build the app and run it in the browser. If the app doesn’t run correctly or if you encounter difficulties, check out the full source code.
Conclusion
This blog post shows a simple way to leverage both Ext JS and Google Maps functionality to seamlessly visualize geospatial data.
Try out this sample app or take a look at the full source code. Leave me a note here if you have any comments or questions.
Try Ext JS
The latest Ext JS version 7.0 has several cool new features. Try the free 30-day trial of Ext JS 7.0 and get started.
 1
1
 1
1
Latest Content

Why JavaScript UI Components Matter More in Complex Frontend Architecture
What This Article Covers Why UI components matter – In complex frontend architecture, reusable JavaScript…
March 26, 2026

Custom vs Prebuilt JavaScript UI Components - Which Is Better for Enterprise
What This Article Covers Build vs. Buy decision – Whether to build custom JavaScript UI…
March 26, 2026

How a JavaScript UI Framework Reduces Frontend Complexity
Frontend development has become dramatically more sophisticated over the last decade. What once involved a…
March 26, 2026


