

 Rapid Ext JS (beta)


Create Custom Charts using Sencha Charts
September 23, 2014
109 Views
Guest Blog Post
Overview
With the launch of Ext JS 5, Sencha introduced a new and more powerful Sencha Charts package, which has built-in support for touch events. This means you can use touch gestures to interact with the charts. Sencha Charts was built with performance in mind and will render charts as SVG or HTML5 Canvas, where appropriate, (or VML in IE8). You can refer to Ext JS 5 Charts Kitchen Sink to test drive and learn more about Sencha Charts.
In this article, you will learn how to create custom charts using the new Sencha Charts package. We’ll demonstrate how to create a new financial chart with William %R indicator.
This article assumes that you have a prior understanding of Sencha Charts architecture. In our view it is one of the best javascript libraries. You can refer to the following articles to understand the architecture and also get a walkthrough of an existing chart implementation:
How can I create a New Financial Chart?
In this section, you will see how to create a custom stock chart – William %R – that is a momentum oscillator measuring the level of the close relative to the high-low range over a given period of time. This is also called “look-back period”.
What’s the Chart All About?
Based on the data, the following data needs to be calculated based on the look-back period:
- Highest-high for the period
- Lowest-low for the period
Once the above values have been calculated, the %R value will be calculated for a record by applying the following formula:
%R = (Highest High - Close)/(Highest High - Lowest Low) * -100
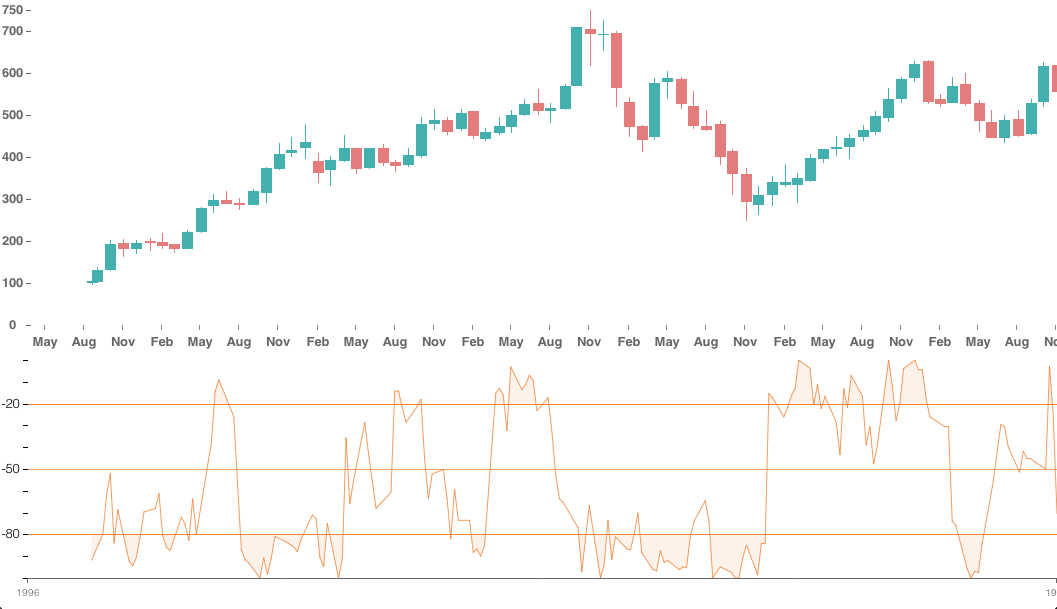
After the %R values have been calculated, we need to draw a chart between %R value and the time, as shown below in a sample William %R chart:
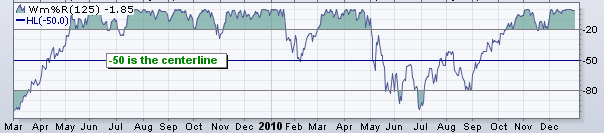
Credit: StockCharts.com
Technically, to create a William %R chart, we would consider the following requirements as the scope for this article:
- It takes the following parameters:
- oversoldLevel – this is typically set to -80. However, it needs to be configurable
- overboughtLevel – this is typically set to -20. However, it needs to be configurable
- lookbackPeriod – this is typically set to 14 days. However, it needs to be configurable
- It draws a numeric axis with -100 as minimum and 0 as maximum values
- The numeric axis indicates the following marks:
- -80 – oversoldLevel
- -20 – overboughtLevel
- -50 – middle
- Horizontal lines are drawn at the following levels:
- -80 – oversoldLevel – continuous line
- -20 – overboughtLevel – continuous line
- -50 – middle – dotted line
- The area above the overboughtLevel and below oversoldLevel need to be filled
- The chart will be created based on Sencha Charts package architecture.
For brevity, I have excluded axis, legend, marker, tooltip, and theme customization.
How do I Structure It?
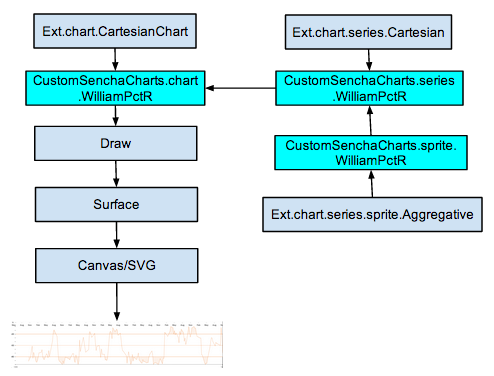
The diagram below shows the specific classes that we need to implement to create William %R chart and how they are connected with Sencha Charts classes:
Time to Get Our Hands Dirty — How do we Implementation the Steps and Code?
With the high-level requirements and design in place, let’s start the implementation.
CustomSenchaCharts.sprite.WilliamPctR
This class implements the William %R sprite logic to draw the lines at -80, -50, and -20 levels. Also, it takes care of filling the areas above -20 and below -80 levels. These levels are configurable, and they are passed as part of the series configuration.
In this class, we have three important methods:
- drawOverBought – draws and fills the area above overboughtLevel, i.e. -20
- drawOverSold – draws and fills the area above oversoldLevel, i.e. -80
- renderAggregates – main method that draws the lines at -80, -50, -20 levels, also calls drawOverBought and drawOverSold methods to draw and fill the overbought and oversold areas, and, finally, draws the series line with the passed stroke style
drawOverBought
This method detects the overbought area, draws it and fills it with the specified stroke style. When the beginning of overbought area is detected, we use the method below to find out the coordinate of the point where y=-20 line intersects the line segment drawn between the points on either side of it:
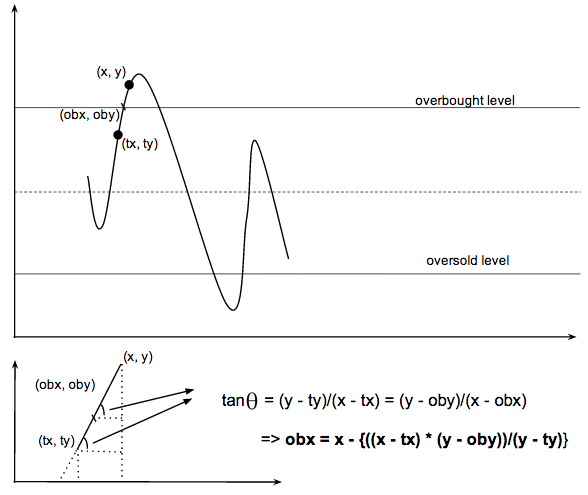
Similarly, logic is followed to detect the end of the area and calculate the coordinate of the point that lies on y=-20.
Following, is the complete implementation of the method:
drawOverBought: function (surface, ctx, start, end, list, xAxis, obLevel) {
var attr = this.attr,
i, x, y, x0, y0, obx = 0, oby = obLevel, obStart = false, obEnd = false;
var lbPeriod = attr.lookBackPeriod – 1;
x0 = list[0];
y0 = list[1];
var tx = x0, ty = y0;
for (i = 3 * lbPeriod; i < list.length; i += 3) {
x = list;
y = list;
//detect if the ob starts
if (ty <= y && ty <= oby && y >= oby) {
//find the x co-ordintate of the point of intersection
obx = x – (((y-oby)*(x-tx))/(y-ty));
//start drawing the path
ctx.beginPath();
ctx.moveTo(obx, oby);
obStart = true;
obEnd = false;
}
//detect if the ob ends
if (ty >= y && ty >= oby && y <= oby) { obx = tx + (((x-tx)*(ty-oby))/(ty-y)); ctx.lineTo(obx, oby); ctx.closePath(); ctx.fill(); obStart = false; obEnd = true; } //keep drawing the line if (y >= oby) {
//if start was not detected – open start
if (!obStart) {
ctx.beginPath();
ctx.moveTo(x0, oby);
ctx.lineTo(x0, y0);
obStart = true;
}
ctx.lineTo(x, y);
}
tx = x, ty = y;
}
//if end is not detected
if (!obEnd) {
ctx.lineTo(x, oby);
ctx.closePath();
ctx.fill();
}
}
drawOverSold
This methods, logically, works similarly to the drawOverBought method where it draws and fills the oversold area with the specified stroke style.
drawOverSold: function (surface, ctx, start, end, list, xAxis, osLevel) {
var attr = this.attr,
i, x, y, x0, y0, osx = 0, osStart = false, osEnd = false, osy = osLevel;
var lbPeriod = attr.lookBackPeriod – 1;
x0 = list[0];
y0 = list[1];
var tx = x0, ty = y0;
for (i = 3 * lbPeriod; i < list.length; i += 3) { x = list; y = list; //detect if the os starts if (ty >= y && ty >= osy && y <= osy) {
//find the x co-ordintate of the point of intersection
osx = tx + (((x-tx)*(ty-osy))/(ty-y));
ctx.beginPath();
ctx.moveTo(osx, osy);
osStart = true;
osEnd = false;
}
//detect if the os ends
if (ty <= y && ty <= osy && y >= osy) {
osx = x – (((y-osy)*(x-tx))/(y-ty));
ctx.lineTo(osx, osy);
ctx.closePath();
ctx.fill();
osStart = false;
osEnd = true;
}
//keep drawing the line
if (y <= osy) {
//if start was not detected – open start
if (!osStart) {
ctx.beginPath();
ctx.moveTo(x, osy);
ctx.lineTo(x, y);
osStart = true;
}
ctx.lineTo(x, y);
}
tx = x, ty = y;
}
//if end is not detected
if (!osEnd) {
// console.log(‘closing!!’);
ctx.lineTo(x, osy);
ctx.closePath();
ctx.fill();
}
}
renderAggregates
This method is called during the rendering of the series, and it takes care of drawing all the sprites for a series. We need to override this method, so we can:
- draw horizontal lines at -80, -50, and -20 levels
- draw line series
- draw and fill overbought and oversold areas
To render the sprites for William %R, first, we transform the overboughtLevel and oversoldLevel to the co-ordinate system that the framework uses:
var obLevel = attr.overboughtLevel * yy + dy;
var osLevel = attr.oversoldLevel * yy + dy;
var midLevel = -50 * yy + dy;
ctx contains the reference to the underlying rendering engine — Canvas or SVG.
After the coordinates have been transformed, we draw the horizontal lines — solid for -80 and -20 and dashed for -50:
//Draw overbought, oversold and -50 mark lines
me.drawYLine(ctx, xLen, obLevel);
me.drawYLine(ctx, xLen, osLevel);
me.drawYLine(ctx, xLen, midLevel, true);
Then, we call the drawOverSold and drawOverbought methods to draw and fill the areas by passing the transformed values to them:
//Draw oversold areas
me.drawOverSold(ctx, list, osLevel);
//Draw overbaught areas
me.drawOverBought(ctx, list, obLevel);
Finally, we draw the path with a stroke by calling drawStroke, which is an existing method on Ext.chart.series.sprite.Line class:
//draw stroke
me.drawStroke(surface, ctx, start, end, list, rect[1] – pixel);
ctx.stroke();
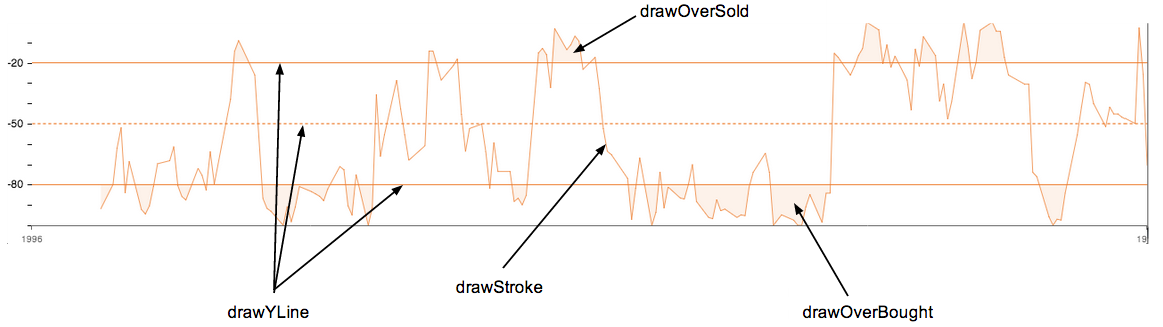
drawYLine
A private method that draws a horizontal line — dashed or solid — for the given y.
drawYLine: function(ctx, length, y, dashed) {
ctx.beginPath();
ctx.moveTo(0, y);
ctx.lineTo(length, y);
ctx.closePath();
var linedash;
if (dashed) {
if (ctx.getLineDash) {
lineDash = ctx.getLineDash();
ctx.setLineDash([3]);
} else {
lineDash = ctx.lineDash;
ctx.lineDash = [3];
}
}
ctx.stroke();
if (dashed) {
if (ctx.setLineDash) {
ctx.setLineDash(lineDash);
} else {
ctx.lineDash = lineDash;
}
}
Now, with the sprite class in place, let’s move on to our next class — CustomSenchaCharts.series.WilliamPctR — where we will implement the series related logic.
CustomSenchaCharts.series.WilliamPctR
The series class accepts the store and following specific parameters:
- overboughtLevel
- oversoldLevel
- lookBackPeriod
The store contains the low, high and close fields that this series class uses to calculate the %R value based on the lookBackPeriod — defaults to 14 days.
The following constructor code calculates %R and sets it on the records on the passed store:
constructor: function (config) {
var me = this;
var st = Ext.data.StoreManager.lookup(config.store);
var recs = st.getRange();
var highs = Ext.Array.pluck(Ext.Array.pluck(recs, “data”), config.highField);
var lows = Ext.Array.pluck(Ext.Array.pluck(recs, “data”), config.lowField);
var lpPeriod = config.lookBackPeriod – 1;
st.each(function (item, index, length) {
if (index < lpPeriod) {
item[“pctr”] = “”;
return;
}
//get highest high of last 14 days
var maxHigh = Ext.Array.max(Ext.Array.slice(highs, index – lpPeriod, index + 1));
//get lowest low of last 14 days
var minHigh = Ext.Array.min(Ext.Array.slice(lows, index – lpPeriod, index + 1));
//calculate %R and set it on the record
var pctr = ((maxHigh – item.data[config.closeField])/(maxHigh – minHigh)) * -100
item.data.pctr = pctr;
});
this.callParent(arguments);
}
Now that we have updated the records with their %R value, there is one more method that we need to implement — actually, override — which is called at the time of rendering the WilliamPctR sprite to get the configuration for the sprite. We need to implement it, so we can pass the overboughtLevel, oversoldLevel, and lookBackPeriod parameters to the sprite, which it uses to draw and fill different sprites:
getDefaultSpriteConfig: function () {
var me = this,
parentStyleConfig = me.callParent(arguments);
return Ext.apply(parentStyleConfig, {
overboughtLevel: me.config.overboughtLevel,
oversoldLevel: me.config.oversoldLevel,
lookBackPeriod: me.config.lookBackPeriod
});
}
Now, we are left with one last class — CustomSenchaCharts.chart.WilliamPctR — the chart that lets us create a William %R chart in an application.
CustomSenchaCharts.chart.WilliamPctR
The chart class extends the CartesianChart, where it expects a numeric type axis to be specified by the caller. It uses the specified numeric axis to draw the %R values. The class sets the following William %R related additional axis configs in its iinitConfig method, which is called at the time on the class initialization:
- fields – the field that would be rendered on the numeric axis; it is set to ‘pctr’ – %R
- minimum – minimum value to be shown on the axis; it is set to -100
- maximum – maximum value to be shown on the axis; it is set to 0 as %R oscillates between 0 and -100
Ext.define(“CustomSenchaCharts.chart.WilliamPctR”, {
extend: ‘Ext.chart.CartesianChart’,
requires: [‘CustomSenchaCharts.series.WilliamPctR’, ‘CustomSenchaCharts.sprite.WilliamPctR’],
xtype: ‘williampctrchart’,
initConfig: function(config) {
var series = config.series[0];
var obLevel = series.overboughtLevel;
var osLevel = series.oversoldLevel;
Ext.Array.each(config.axes, function(axis, index, recs) {
if (axis.type === ‘numeric’) {
Ext.apply(axis, {
fields: [‘pctr’],
maximum: 0,
minimum: -100,
renderer: function (value, layoutContext, lastValue) {
if (value == osLevel || value == -50 || value == obLevel){
return value;
} else {
return “”;
}
}
});
}
});
this.callParent(arguments);
}
});
We’re almost done except for one final step where we will use the above chart in an application and see it in action.
How can we see it in Action?
In the previous section, we defined a WilliamPctR chart with ‘williampctrchart’ xtype. Let’s see how we can use it in our sample application.
To use the above chart in an application, we can either instantiate it using Ext.create call or use the xtype. For example, here is the code showing the configuration to add this chart to an Ext JS container as one of its items:
{
xclass: ‘CustomSenchaCharts.chart.WilliamPctR’,
height: 250,
docked: ‘bottom’,
insetPadding: 0,
background: ‘white’,
series: [
{
store: ‘Apple’,
type: ‘williampctr’,
xField: ‘date’,
yField: ‘pctr’,
highField: “high”,
lowField: “low”,
closeField: “close”,
overboughtLevel: -20,
oversoldLevel: -80,
lookBackPeriod: 14, //in days
style: {
stroke: ‘rgba(237,123,43,0.75)’,
fill: ‘rgba(237,123,43,0.1)’,
miterLimit: 1
}
}
],
axes: [
{
type: ‘numeric’,
position: ‘left’,
style: {
axisLine: false
}
},
{
type: ‘time’,
position: ‘bottom’,
fields: [‘date’],
style: {
strokeStyle: ‘#666’,
estStepSize: 150
},
dateFormat: ‘Y’,
segmenter: {
type: ‘time’,
step: {
unit: ‘y’,
step: 1
}
},
label: {
fontSize: 10,
fillStyle: ‘#666’
}
}
]
}
The following shows the William %R output:
You may download the complete code from GitHub. Note: this code was written using the current version of Ext JS (5.0.1).
Are you ready to get started building amazing web charts?
In this article, we discussed how to create a custom stock chart based on the Cartesian coordinate system by implementing a custom chart, series and a sprite. We then saw how to use the custom stock chart in an Ext JS 5 application. We hope this article has helped you understand the overall structure of the Sencha Charts package, important classes, their responsibilities, interactions and how you can create a custom chart. Find out more about Ext JS!
References
What's your reaction?
 0
0

 0
0

Latest Content

Discover the Top 07 Architecture Patterns used in Modern Enterprise Software Development
Developing software without an architecture pattern may have been an option back then. However, that’s…
April 11, 2024

JavaScript Design Patterns: A Hands-On Guide with Real-world Examples
As a web developer, you know how popular JavaScript is in the web app development…
March 26, 2024
Virtual JS Days 2024のハイライト
2024年2月20日~22日、第3回目となる「Virtual JavaScript Days」が開催されました。JavaScript の幅広いトピックを採り上げた数多くのセッションを実施。その内容は、Senchaの最新製品、ReExt、Rapid Ext JSまで多岐にわたり、JavaScriptの最新のサンプルも含まれます。 このカンファレンスでは多くのトピックをカバーしています。Senchaでセールスエンジニアを務めるMarc Gusmano氏は、注目すべきセッションを主催しました。Marc は Sencha の最新製品「ReExt」について、詳細なプレゼンテーションを実施。その機能とメリットを、参加者に理解してもらうべく詳細に説明しました。 カンファレンスは、Senchaのジェネラルマネージャを務めるStephen Strake氏によるキーノートでスタートしました。キーノートでは、会社の将来のビジョンについての洞察を共有しています。世界中から JavaScript 開発者、エンジニア、愛好家が集まるとてもエキサイティングなイベントとなりました。これは、JavaScript…
March 25, 2024


