


 Ask Sencha AI
Creating Custom Reporting Front-Ends with Ext JS
June 23, 2016
2713 Views
Get a summary of this article:
Today, everything is online, making dynamic reporting tools essential. Businesses need interactive systems to analyze and display data effectively. Ext JS is a powerful JavaScript framework for this purpose. It offers excellent features for data management, visualization, and user interaction.
This blog explains the importance of dynamic reports. It highlights how Ext JS simplifies creating such reports. We’ll start with basic components like the Data Package, Data Grid, and Pivot Grid. These tools help with data management, analysis, and visualization.
We’ll also walk through setting up the Ext JS development environment. You’ll learn how to use its tools to build stable apps. The blog will discuss creating comparative tables to visualize data and how to export it to Excel and CSV formats.
With Ext JS, creating reports—simple or complex—is easy. It helps developers create user-friendly, interactive reporting solutions. By the end, you’ll understand why Ext JS is a top choice for modern business applications. Let’s get started.
What Are the Key Features and Advantages of the Ext JS Framework?
Ext JS aims to enhance user experience. It is one of the most robust JavaScript frameworks for front-end development. Its key features and advantages include:
1. Rich Component Library
Ext JS offers a wide range of pre-built components like grids, forms, and charts. Developers can create complex applications with less code, saving time and effort.
2. MVC Architecture
The framework uses the MVC architecture, which separates data, presentation, and logic. This improves collaboration and version control.
3. Data Binding and Grids
Ext JS supports real-time data binding. Changes in the data model automatically update the UI, enhancing user interaction.
4. Cross-Browser Compatibility
Ext JS ensures that applications work seamlessly across all major web browsers without adjustments.
5. Theming and Customization
Developers can customize application styles and create themes for different interfaces.
6. Responsive Design
Ext JS supports responsive design. Applications adapt to different screen sizes and resolutions, providing a consistent experience across devices.
7. Scalability and Performance
Ext JS is built for scalability. It handles complex operations efficiently without performance issues.
These features make Ext JS ideal for developing modern web applications.

How to Set up the Ext JS Development Environment?
Here’s a step-by-step guide to configuring Ext JS:
1. Downloading the Library Files
Visit the Sencha website to download the Ext JS trial version. Register to receive the file “ext-6.0.1-trial” and save it on your computer.
2. Extracting Essential Files
Extract the library files. Key files include:
- Ext.js: Core file with essential features.
- Ext-all.js: Optimized for production, without comments.
- Ext-all-debug.js: Includes comments for easier debugging.
- Ext-all-dev.js: For development, with helpful comments.
- CSS Files: Located in the \build\classic folder for desktop themes and \build\modern for mobile themes.
Add these files into your HTML using the appropriate script.
<link rel="stylesheet" type="text/css" href="../ext-6.0.1-trial/ext-6.0.1/build/classic/theme-classic/resources/theme-classic-all.css" />
<script type="text/javascript" src="../ext-6.0.1-trial/ext-6.0.1/build/ext-all.js"></script>
<script type="text/javascript" src="app.js"></script>
3. CDN Setup
You can skip the download by using a content delivery network (CDN). Add the following links directly into your code:
<link rel="stylesheet" type="text/css" href="https://cdnjs.cloudflare.com/ajax/libs/extjs/6.0.0/classic/theme-crisp/resources/theme-crisp-all.css" />
<script type="text/javascript" src="https://cdnjs.cloudflare.com/ajax/libs/extjs/6.0.0/ext-all.js"></script>
<script type="text/javascript" src="app.js"></script>
4. Tools and Browser Compatibility
Use editors like Notepad++, Sublime Text, or Eclipse. Sublime Text is recommended. Ext JS is compatible with major browsers, including Google Chrome, Firefox, Safari, Opera, and Internet Explorer (version 6+).
Once you complete these steps, you’re ready to develop with Ext JS!
Data Management
Traditionally, reports were simple visual tools to share raw or aggregated data. They were often displayed as rows and columns using basic HTML tables. However, modern users demand much more from their reports. They not only want to view data but also interact with it. Features like sorting, filtering, and grouping have become essential for reports today.
Managing Data with Ext JS
To enable such advanced interactions, managing data in the browser’s memory is crucial. The Ext JS Data Package is a key component of the framework. It allows seamless management of application data directly in the browser.
The package includes various classes, with three being the most important:
- Model: Creates a model representation of data for the browser.
- Store: Provides a collection store for your records.
- Proxy: Loads and saves data from remote or local sources.
With these tools, Ext JS simplifies operations like sorting, filtering, and grouping, whether locally or remotely.
Data Display with Ext JS
Reports often display numerical data in tabular formats, alongside text, links, or images. For this purpose, data grids are the preferred choice.
The Ext JS Data Grid is a standout component. It helps present data in an orderly format and offers interactivity similar to spreadsheet applications. Key features include:
- Sorting, filtering, and grouping.
- Pagination and column reordering.
- Tree grids, data selection, and formatting.
Ext JS grids work seamlessly with the data package, allowing large volumes of data to be displayed and interacted with efficiently. It is one of the most powerful and versatile data grid solutions available for web development.
The Ext JS Grid not only allows you to interact with your data, but also manipulate it, if needed, and the associated data package helps you keep the data in sync with your back-end database (remote or local).
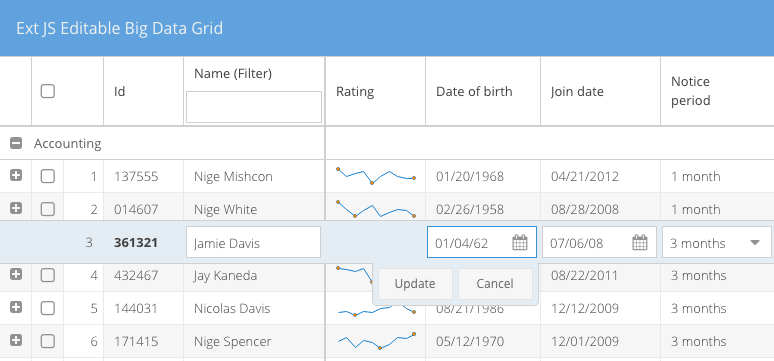
Another great aspect of the Ext JS Grid is that it lets you use micro-charts within the cells, so you can start to visualize your data with the tabular displays.
Data Visualization
Most reports today use some form of data visualization. This is because tabular data becomes difficult to understand after a certain number of rows and columns. In reports, the main goal of data visualization is to explain the story that the data tells using charts and graphs.
For example, consider the question: Are my sales trending upward or downward? It’s hard to answer this by just looking at a table of sales data. Data visualization adds intuitiveness, making it easier to understand the information in a report.
Ext JS provides an excellent charting package called Sencha Charts. If you haven’t seen it, browse through the many beautiful examples in the Sencha Charts Kitchen Sink. Like other Ext JS components, Sencha Charts is pre-wired to the data package. This means you don’t need much coding to add charts to your reports.
One major benefit of Sencha Charts is automatic updates. When you update the data in your models, both grids and charts update automatically. This happens because they feed off the same models and stores unless explicitly told otherwise.
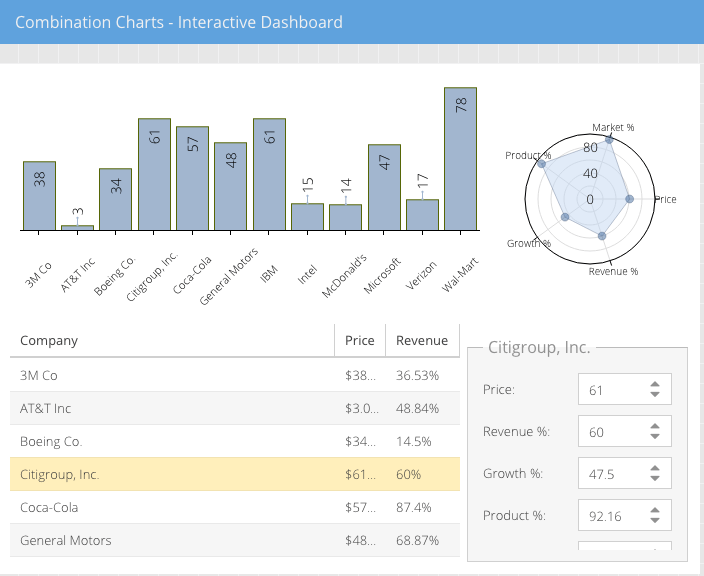
The Ext JS Data Package helps you keep the tabular and graphical elements of your reports in sync. This is very difficult to achieve if you plan on using other third-party charting libraries, because they require tight integration between the charts/graphs and the Ext JS data package.
Data Analysis
As mentioned before, today’s end users are much more sophisticated and demanding. They expect to slice and dice their data. This is probably the most difficult part of building a custom reporting front-end.
You need components for displaying, managing, and interacting with your data. You also need components for aggregating your data on the fly.
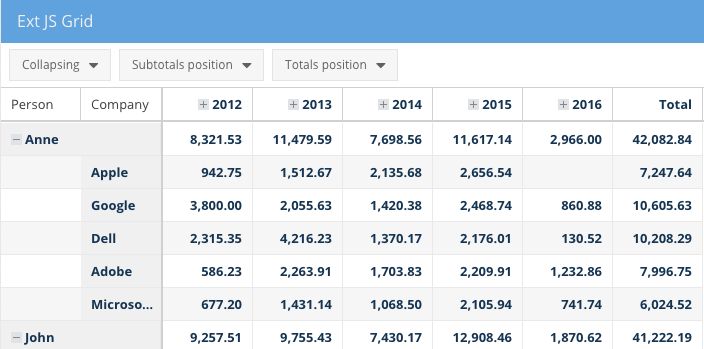
The Pivot Grid component, part of the Ext JS Premium package, enables rapid summarization of large data sets. It provides a simple way to aggregate records across one or more dimensions. You do this by defining an ‘axis’ and an ‘aggregation’.
Depending on your data size, you can perform aggregations in your browser’s memory. Alternatively, you can use a back-end aggregation script to avoid freezing the browser with large data sets.
The ‘axis’ lets you determine the rows and columns in your report. The ‘aggregation’ manages the calculations.
Pivot Grid includes many aggregation methods. These include sum, average, min, max, and count. You can also define your own aggregation functions.
Any results generated by Pivot Grid can be sorted, grouped, filtered, and displayed in various layouts. These layouts include ‘outline’ or ‘compact’ for proper display.
Pivot Grid also allows you to add subtotals and grand totals across rows and columns. This is optional.
If you can’t anticipate how users will interact with the data, Pivot Grid has a configurator plugin. This plugin lets an end user select or deselect dimensions and aggregations. It offers an easy-to-use drag-and-drop environment.
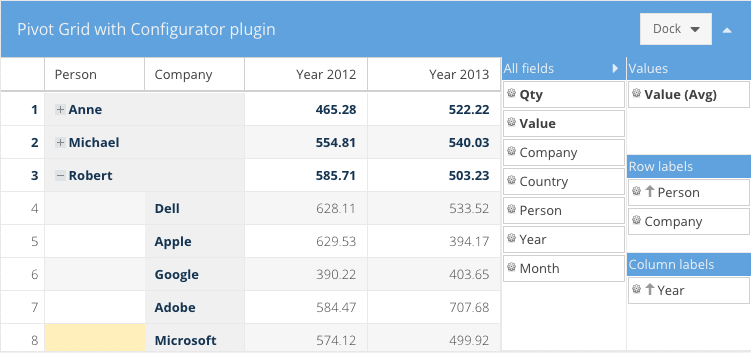
Furthermore, you can drill down to the raw data using Pivot Grid, should you need to. All of these out-of-the-box functionalities make it very easy to create a custom reporting front-end for your Ext JS applications.
Data Export
Finally, the last but very critical piece of creating any custom reporting front-end is data export capability. Users always want to export data into formats such as Excel, CSV, TSV, etc. They want to use the data in other systems for various reasons.
For instance, someone may want to export a report from a business application. They might import the data into accounting software to combine and analyze it with information in that system.
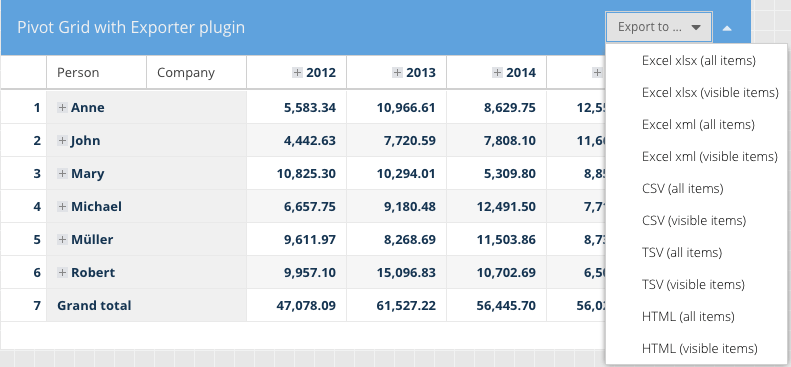
The Ext JS Data Export plugin allows any data in an Ext JS Grid or Pivot Grid to be exported. It supports Excel, CSV, TSV, XML, and HTML formats.
Conclusion
Ext JS is a powerful framework for creating custom reporting front-ends. It provides essential features like rich components and MVC architecture. The framework also includes advanced data management tools such as the Data Package and Pivot Grid. These features simplify complex tasks.
They enhance data visualization and improve user interaction. By setting up the Ext JS development environment, developers can build interactive reports efficiently. The ability to export data in various formats makes Ext JS versatile. Ext JS helps create dynamic, user-friendly reporting solutions. It meets the demands of today’s users.
FAQs
What is Ext JS?
Ext JS is a JavaScript framework for building interactive, data-driven web applications.
What is the Pivot Grid used for?
The Pivot Grid is used for summarizing and aggregating large data sets quickly.
Can Ext JS handle large amounts of data?
Yes, Ext JS efficiently manages large data sets with its data management tools.
What is the benefit of using Sencha Charts?
Sencha Charts provides powerful, easy-to-integrate data visualization tools for dynamic reports.
How do I export data from Ext JS?
Ext JS allows exporting data to formats like Excel, CSV, and XML with ease.


Latest Content

JS Days Is Back: A Free Virtual Conference for JavaScript Developers
Sencha is bringing back JS Days, a free, two-day online conference for JavaScript developers. Dates:…
July 2, 2026

What Is DORA? A Complete Guide to the EU's Digital Operational Resilience Act (2026)
Last Updated: June 2026 The Digital Operational Resilience Act (DORA) is one of the most…
June 17, 2026

Top 8 Best Practices for Enterprise Software Development in 2026
Enterprise software development in 2026 demands a different approach than consumer application development. Enterprise teams…
June 3, 2026


