



 Ask Sencha AI
5 Powerful Ext JS Pivot Grid Features
July 7, 2020
6621 Views
Get a summary of this article:
The Ext JS Pivot Grid provides a simple way to condense many data points into a format to quickly draw insights and trends from data. In this post we cover 5 powerful Ext JS Pivot Grid features.
1. Axis and Aggregation
The Pivot Grid relies on two pieces that extend the native grid panel:
- Axis: allows you to determine row and column placement
- Aggregation: manages the grouping calculations
These pieces need to be defined on the pivot matrix object used by the Pivot Grid.
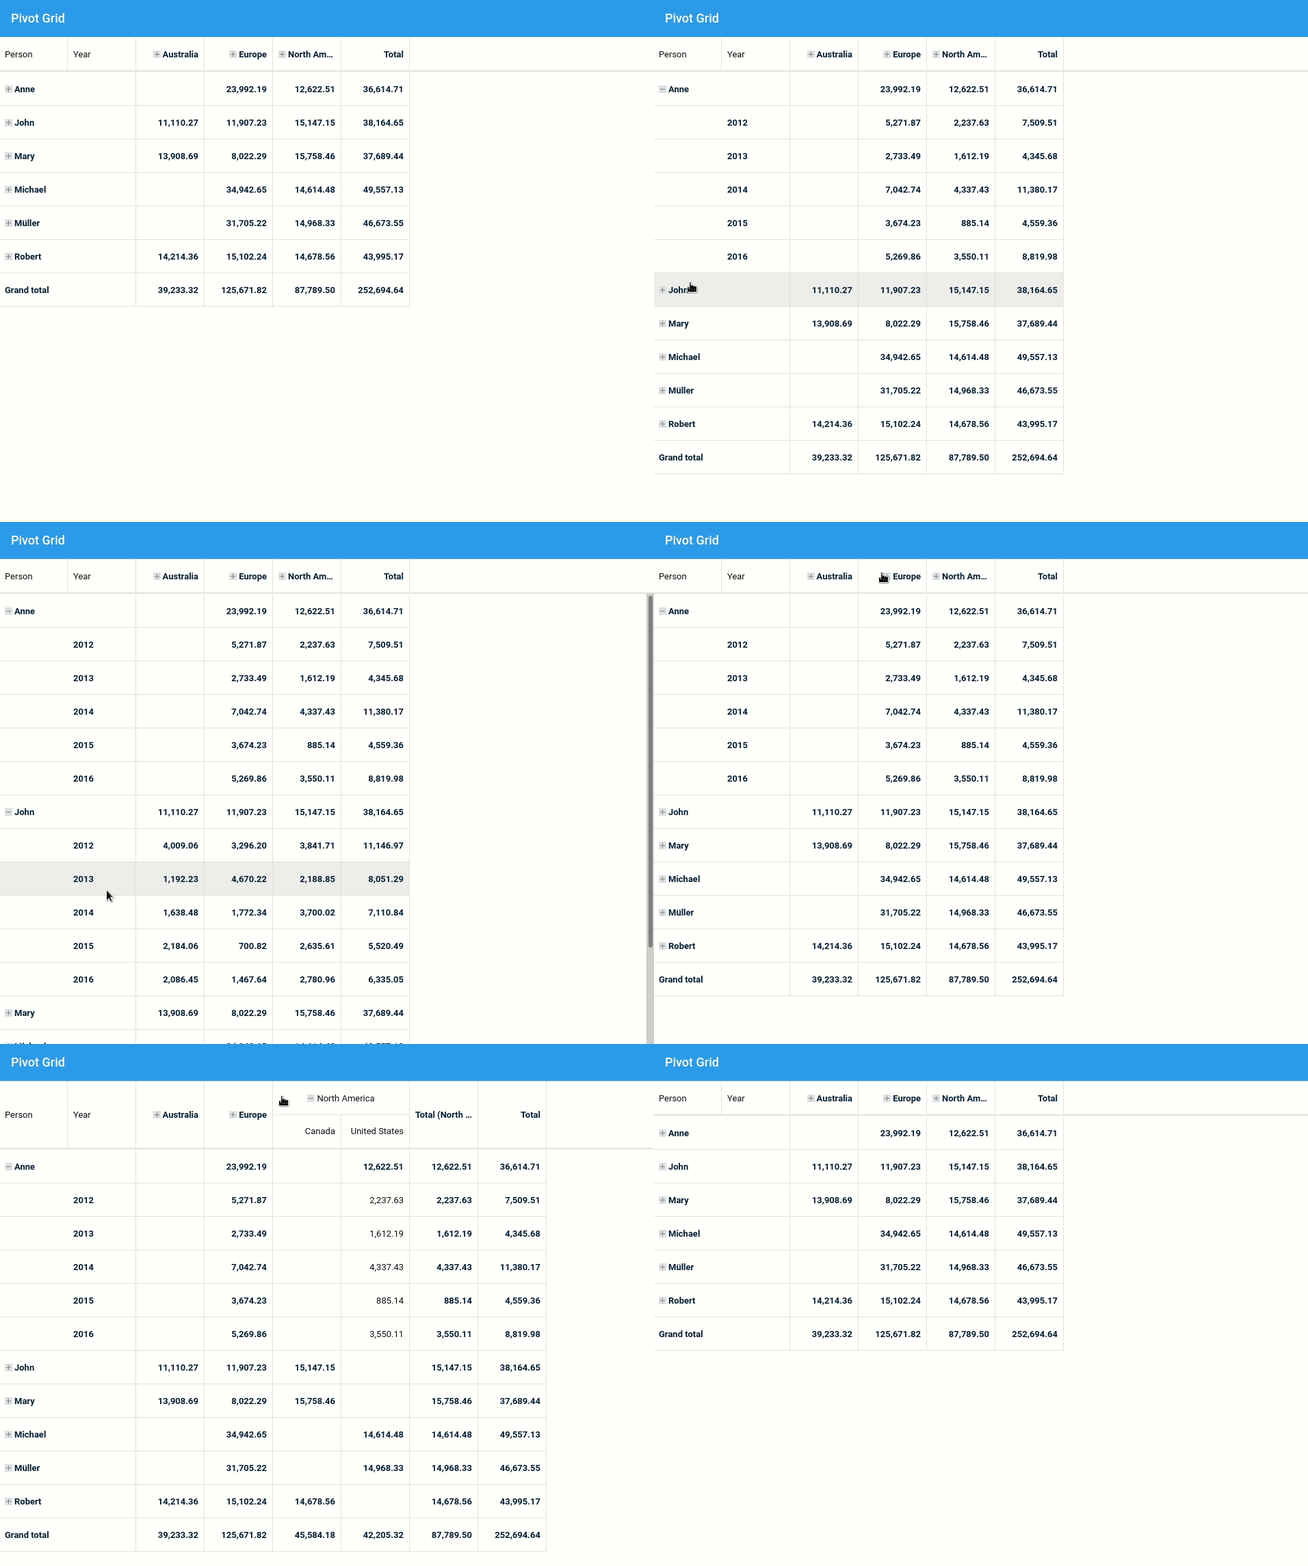
How to:
1. Create a Pivot Grid with “matrix” object
Ext.define('Fiddle.view.pivot.Grid', {
	extend: 'Ext.pivot.Grid',
	xtype: 'configurable-pivot-grid',
	controller: 'pivotgrid',

	title: 'Pivot Grid',

	matrix: {
    	store: {
            type: 'sales'
    	}
	}
});
2. Add axis configuration
matrix: {
	store: {
    	type: 'sales'
	},
	leftAxis: [{
    	dataIndex: 'person',
    	header: 'Person'
	},{
    	dataIndex: 'year',
    	header: 'Year'
	}],
	topAxis: [{
    	dataIndex: 'continent',
    	header: 'Continent'
	}, {
    	dataIndex: 'country',
    	header: 'Country'
	}]
}
3. Add aggregation configuration
matrix: {
	store: {
    	type: 'sales'
	},
	leftAxis: [{
    	dataIndex: 'person',
    	header: 'Person'
	},{
    	dataIndex: 'year',
    	header: 'Year'
	}],
	topAxis: [{
    	dataIndex: 'continent',
    	header: 'Continent'
	}, {
    	dataIndex: 'country',
    	header: 'Country'
	}],
	aggregate: [{
    	dataIndex: 'value',
    	header: 'Total',
    	aggregator: 'sum'
	}]
}
Sencha Fiddle:
Many in-built methods are available such as sum, average, min and so on but it is possible to define a custom method to aggregate data:
aggregator: 'myOwnFn'
2. Filtering
- Filtering by label
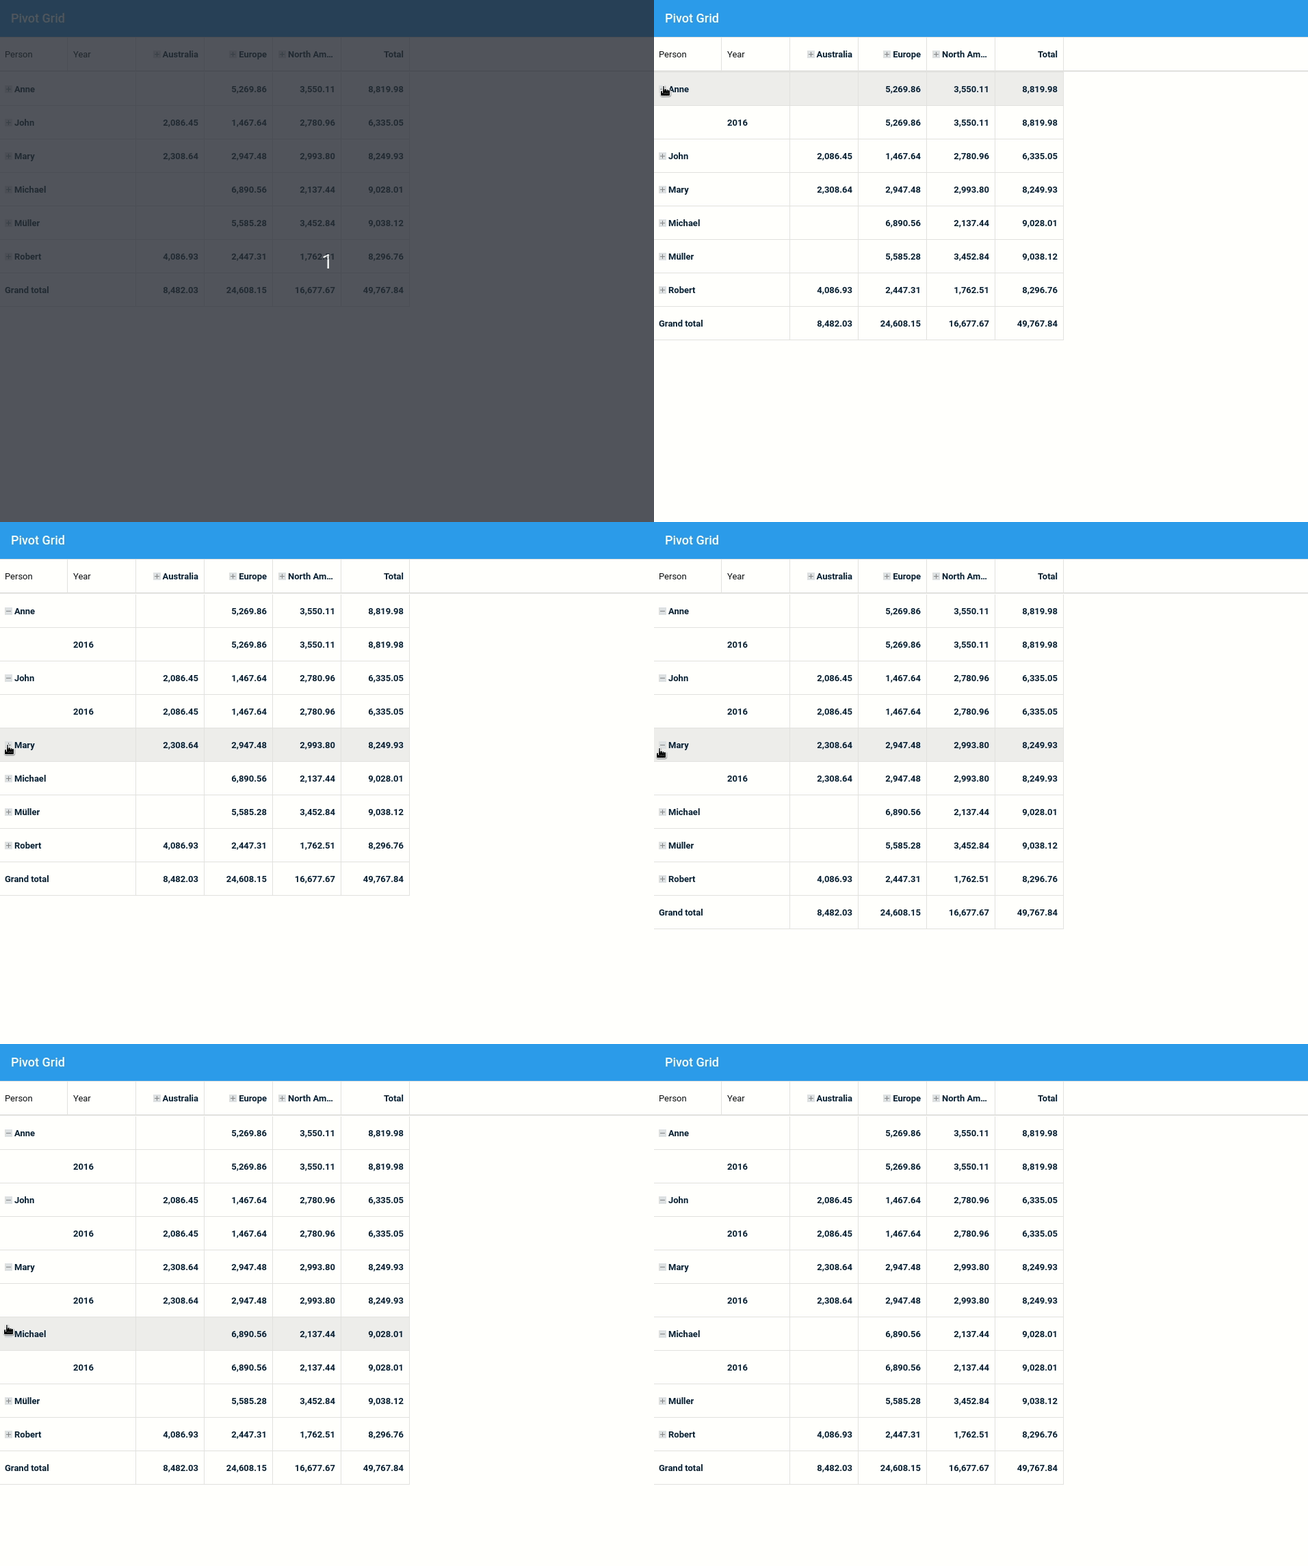
Filtering to display the year 2016.
leftAxis: [{
    dataIndex: 'person',
    header: 'Person'
}, {
    dataIndex: 'year',
    header: 'Year',
    filter: {
        type: 'label',
        operator: '=',
        value: 2016
    }
}]
Sencha Fiddle:
- Filtering by value
Filtering to display the 3-best year
matrix: {
	store: {
    	type: 'sales'
	},
	aggregate: [{
    	dataIndex: 'value',
    	header: 'Total',
    	aggregator: 'sum',
    	id: 'agg',
	}],
	leftAxis: [{
    	dataIndex: 'person',
    	header: 'Person'
	}],
	topAxis: [{
    	dataIndex: 'year',
    	header: 'Year',
    	filter: {
            type: 'value',
            operator: 'top10',
            topType: 'items',
            topOrder: 'top',
            dimensionId: 'agg',
            value: 3
     	}
	}]
}
Sencha Fiddle:
3. Multiple Grand Totals
With a Pivot Grid it’s possible to add multiple grand totals.
How to:
listeners: {
	pivotbuildtotals: function (matrix, totals) {
    	var dataAvg = {},
            dataMax = {};
        Ext.Array.each(matrix.model, function (field) {
            var result,
                agg;
            if (field.col && field.agg) {
                agg = matrix.aggregate.getByKey(field.agg);
                result = matrix.results.get(matrix.grandTotalKey, field.col);
                if (result && agg) {
                    dataAvg = result.calculateByFn(
                        'totalavg',
                        agg.dataIndex,
                        Ext.pivot.Aggregators.avg);
                    dataMax = result.calculateByFn(
                        'totalmax',
                        agg.dataIndex,
                        Ext.pivot.Aggregators.max);
                }
            }
    	});
    	totals.push({
            title: 'Grand total (avg)',
            values: dataAvg
    	}, {
            title: 'Grand total (max)',
            values: dataMax
    	});
	}
}
Sencha Fiddle:
4. Range Grouping
How to:
{
	dataIndex: 'year',
	header: 'Year',
	grouperFn: function (record) {

    	var dataIndex = this.dataIndex,

            recIndex = record.get(dataIndex);

    	if (recIndex >= 1980 && recIndex < 1990) return "80'"; if (recIndex >= 1990 && recIndex < 2000) return "90'"; if (recIndex >= 2000 && recIndex < 2010) return "00'";

    	return 'Rest';
	}
}
Sencha Fiddle:
5. Drill Down
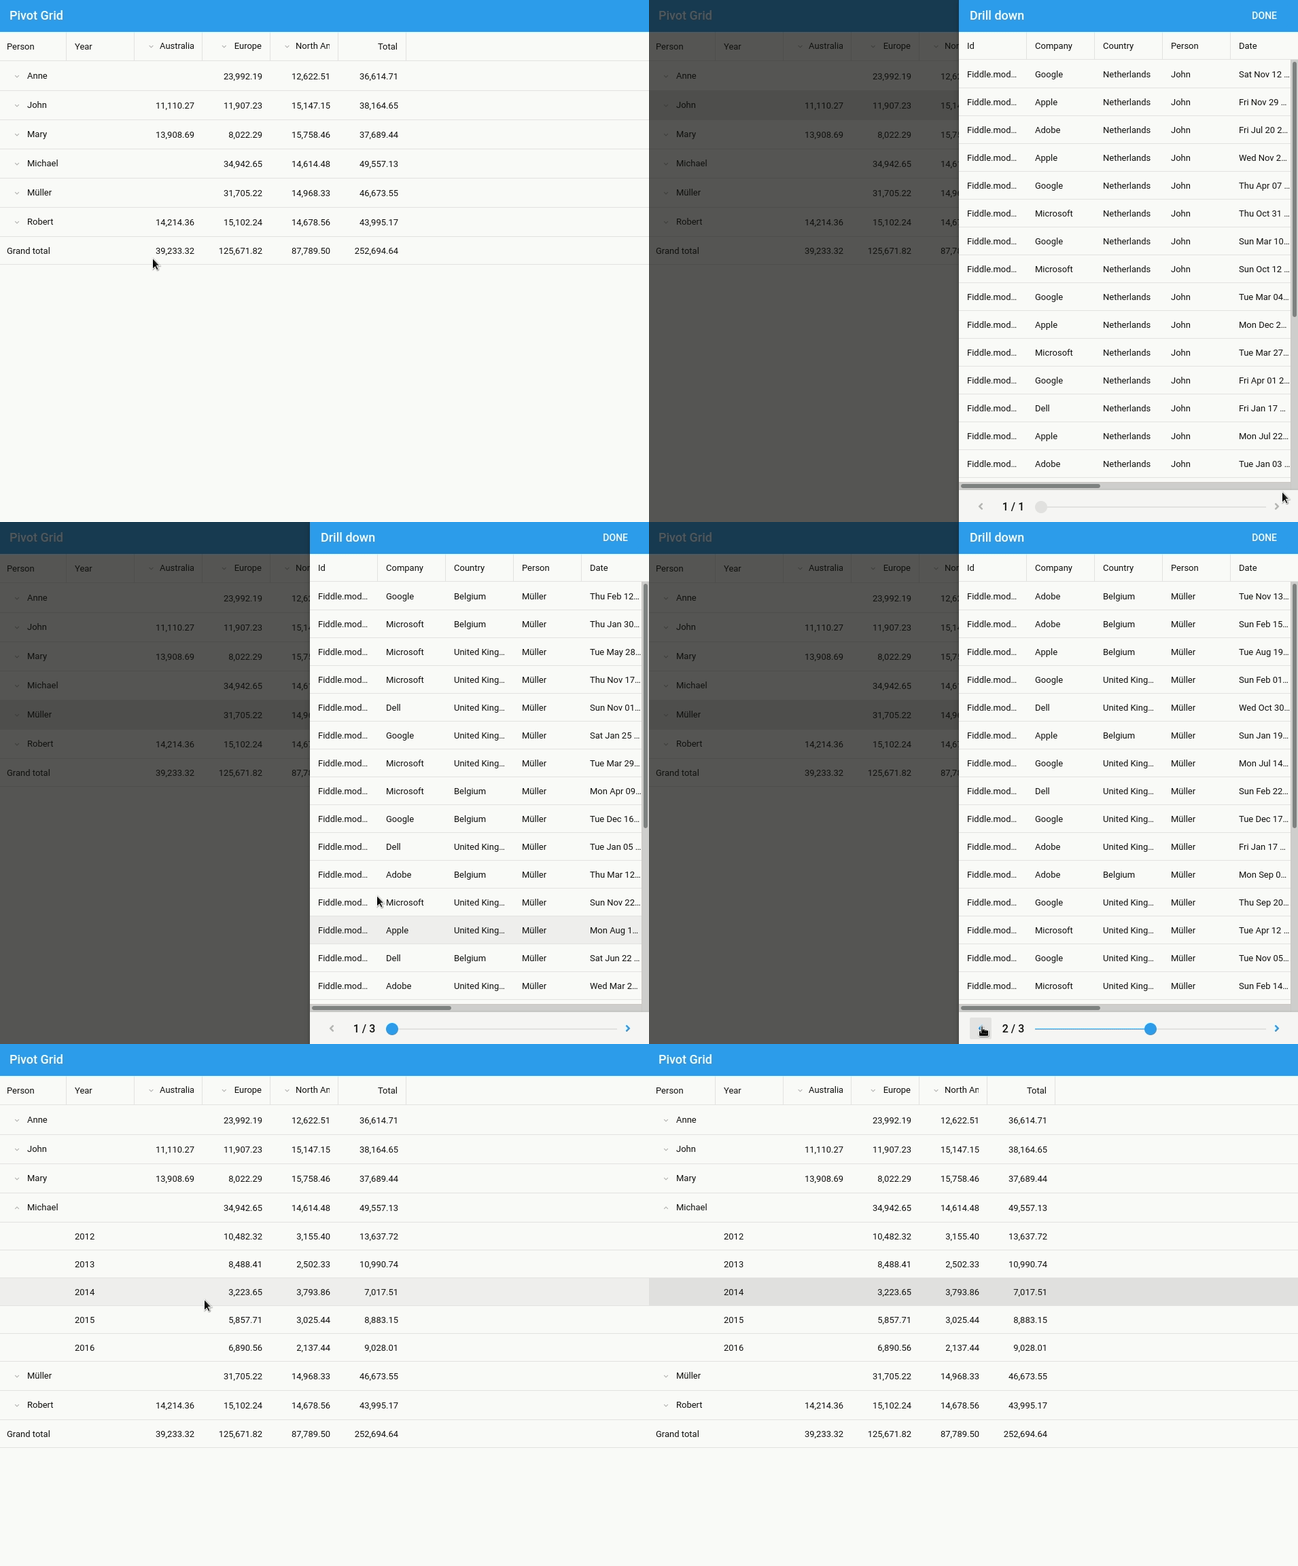
How to:
Ext.define('Fiddle.view.pivot.Grid', {
    extend: 'Ext.pivot.Grid',
    xtype: 'configurable-pivot-grid',
    controller: 'pivotgrid',
    title: 'Pivot Grid',
    //Add drill down plugin
    plugins: {
        pivotdrilldown: true
    },
    matrix: {
        /* Matrix configuration */
    }
});
Sencha Fiddle:
Build Your Pivot Grid with Ext JS 7.2
The free 30-day trial of Ext JS 7.2 provides full access to the product features. Get started today and see how you can build a powerful pivot grid to make insights from data more apparent.
 1
1
 1
1
Latest Content

How to Handle Millions of Rows in a React Data Grid: Buffered Rendering and Server-Side Data
A React data grid that feels instant with 1,000 rows can freeze with 100,000 and…
October 16, 2026

How to Choose a React Grid Component: 12 Features Enterprise Apps Need
Picking a React grid component looks easy in week one. Every option sorts columns and…
October 16, 2026

Enterprise React Data Grid: The Features Enterprise Teams Need, and What Each Grid Includes
Almost every enterprise React data grid advertises the same features: grouping, pivoting, Excel export, clipboard,…
October 16, 2026