


 Ask Sencha AI
Announcing Sencha Pivot Grid
March 11, 2015
755 Views
Get a summary of this article:
 We are very excited to announce the general availability of Sencha Pivot Grid. Now you can quickly and easily add powerful pivot grid functionality to your Ext JS applications — allowing your users to summarize and analyze data to make more informed decisions. Based on technology acquired from mzSolutions, you can now build Ext JS applications that enable users to discover critical insights from massive sets of data — helping them to harness the power of big data. Key features enable users to:
- Add basic Business Intelligence (BI) capabilities to web applications
- Aggregate multi dimensional data in web applications built using Ext JS Grids
- Automatically sort, count, average or total data and summarized results
- Analyze data in web applications in an Excel-like manner
- Visualize data from Sencha Pivot Grid using Ext JS Charts
An example of Sencha Pivot Grid with aggregated data from Ext JS Grid:
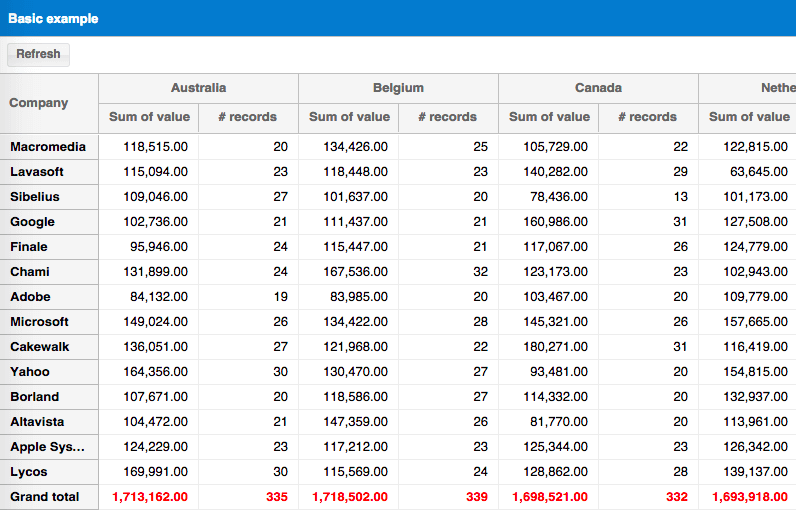
Sencha Pivot Grid can quickly and easily be configured to help users better analyze large data sets:

Sencha Pivot Grid provides out of the box integration with Ext JS Charts to make it easier for teams to aggregate, analyze and visualize the data:

Sencha Pivot Grid is compatible with Ext JS 4.1.x, 4.2.x, 5.0.x. Compatibility with 5.1 is planned for early Q2.
Learn more:
As a special introductory offer, you can get a 25% discount when you buy Sencha Pivot Grid in March. Contact our sales team to learn more.
 2
2

Latest Content

What's New in Ext JS 8.0
Unlock Suite of Modern Upgrades & New Capabilities Seamlessly Ext JS 8.0 introduces a broad…
April 6, 2026

Why JavaScript UI Components Matter More in Complex Frontend Architecture
What This Article Covers Why UI components matter – In complex frontend architecture, reusable JavaScript…
March 26, 2026
Custom vs Prebuilt JavaScript UI Components - Which Is Better for Enterprise
What This Article Covers Build vs. Buy decision – Whether to build custom JavaScript UI…
March 26, 2026


