


 Ask Sencha AI
How to Quickly Customize Ext JS Data Grid (Part 5/6) – Widget Column Methods
March 27, 2020
3738 Views
Get a summary of this article:
Widgets are cool. They add a nice functional and visual cue to an already robust and intuitive data grid. With ExtJS, adding widgets to grids is quick and easy. The Ext JS component widgets are interoperable (unlike other open source components hand-picked from different sources), so you’ll never face any compatibility, performance or other issues adding them.
Let’s look into how widget column methods can be used to customize grid data.
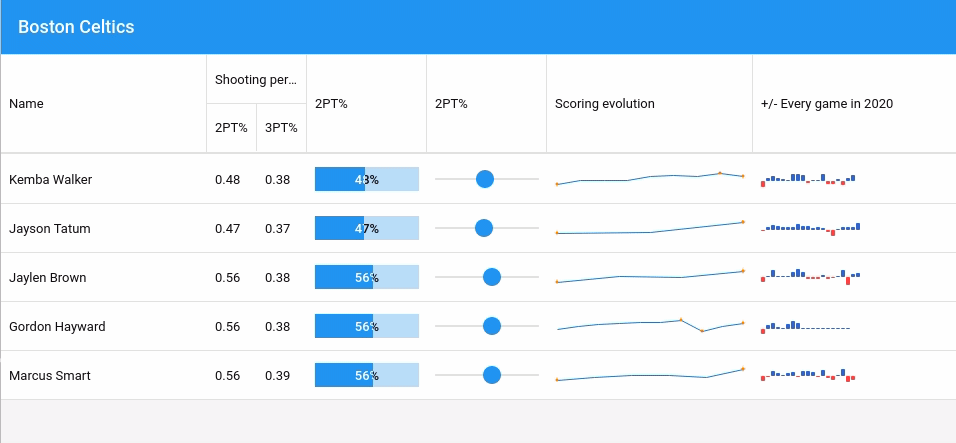
The example grid used throughout the blog series displays NBA 2020 player ratings.
Widgetcolumn [classic]
With widget column, you can customize how to display data using the following components:
- Button
- Progress bar
- Slider
- Line
- Bar
This is how the initial data is setup:
{
            player: 'Kemba Walker',
            team: 'Boston Celtics',
            rating: 88,
            dunkRating: 30,
            threePointRating: 83,
            position: 'PG',
            ht: 60,
            salary : 32742000,
            twoPointPercent: 0.48,
            threePointPercent: 0.38,
            scoringEvolution : [12,17,17,17,21,23,22,25,22],
            plusMinusEvolution2020 : [-16,7,13,8,4,0,20,21,18,-4,2,0,22,-8,-9,4,-10,7,16]
    	},
    	{
            player: 'Jayson Tatum',
            team: 'Boston Celtics',
            rating: 86,
            dunkRating: 83,
            threePointRating: 90,
            position: 'SF',
            ht: 68,
            salary:7830000,
            twoPointPercent: 0.47,
            threePointPercent: 0.37,
            scoringEvolution : [14,15,22],
            plusMinusEvolution2020 : [-4,9,20,16,12,9,13,23,16,14,6,12,8,-6,-23,4,11,13,11,31]
    	}
Define widget in column configuration ‘widgetcolumn’. Here we have a slider and a sparkline widget.
{
    	text: '2PT%',
    	xtype: 'widgetcolumn',
    	width: 120,
    	widget: {
            xtype: 'sliderwidget',
            minValue: 0,
            maxValue: 1,
            bind: '{record.twoPointPercent}',
            publishOnComplete: false,
            decimalPrecision: 2
    	}
},
{
    	text: 'Scoring evolution',
    	flex: 1,
    	xtype: 'widgetcolumn',
    	widget: {
            xtype: 'sparklineline',
            bind: '{record.scoringEvolution}',
            tipTpl: 'Value: {y:number("0.00")}'
    	}
}
Widget is bound to ‘record’ and it is possible to customize data display with ‘texTpl’ and ‘tipTpl’.
Sencha Fiddle:
The Ext JS component library contains over 100 components that can be integrated into your application. For example, you can use a slider, line, bar, bullet, pie, box chart and many more within the grid cell. To see what’s possible, check out some more widget examples.
The Stock Ticker is another example that shows how you can use a line chart and slider to provide live stock price updates.
Stay tuned for our next article covering ‘How to add Custom CSS to Grid Elements.’
Build Your Data Grid with Ext JS 7.1
The free 30-day trial of Ext JS 7.1 provides full access to the product features. Get started today and see how you can build a high-performing data grid for your application.


Latest Content

What Is DORA? A Complete Guide to the EU's Digital Operational Resilience Act (2026)
Last Updated: June 2026 The Digital Operational Resilience Act (DORA) is one of the most…
June 17, 2026

Top 8 Best Practices for Enterprise Software Development in 2026
Enterprise software development in 2026 demands a different approach than consumer application development. Enterprise teams…
June 3, 2026

JavaScript Framework vs Library: Key Differences Explained for 2026
JavaScript frameworks and libraries serve different purposes in enterprise development. Frameworks such as Ext JS…
June 3, 2026


