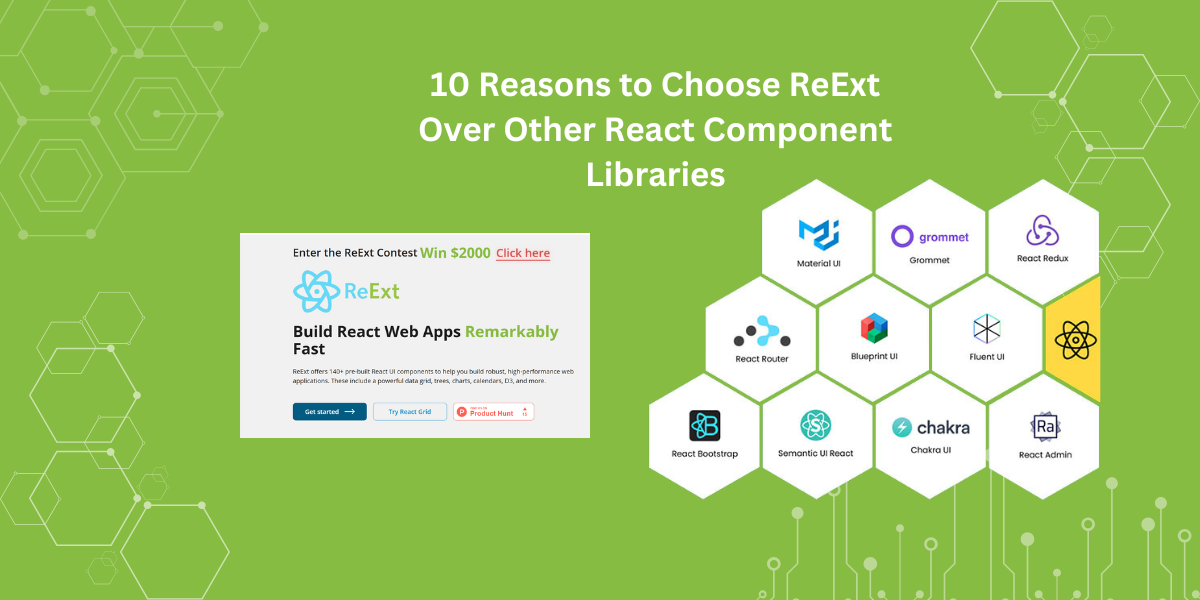
10 Reasons to Choose ReExt Over Other React Component Libraries
 Team Sencha
Read More
Team Sencha
Read More
December 13, 2024
148 Views
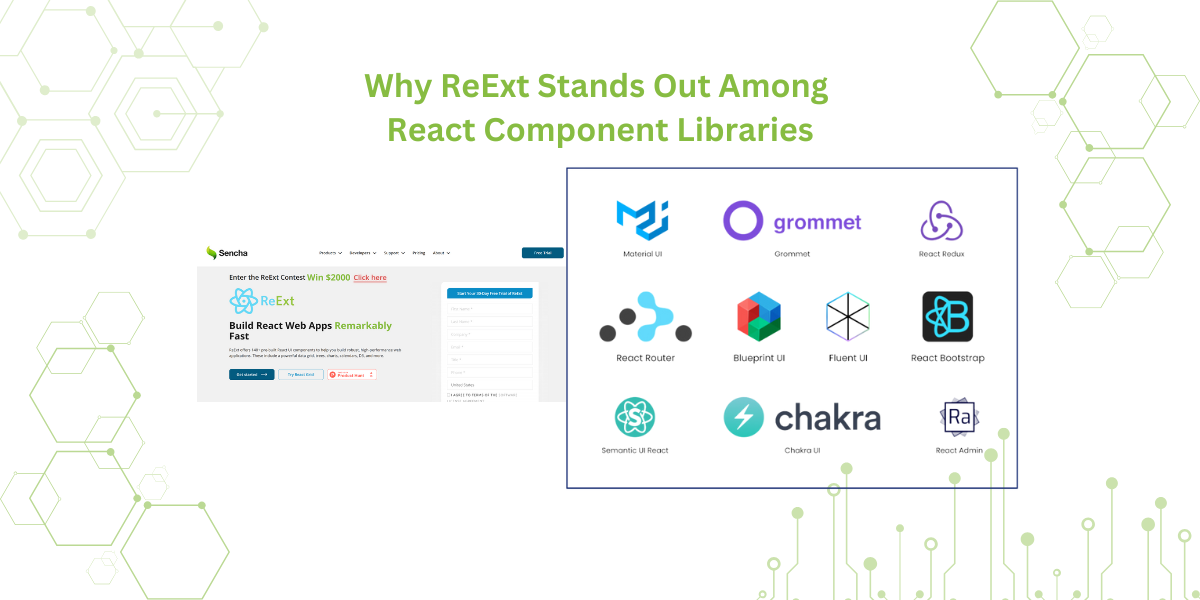
It is fundamental for the robustness of your project to choose the right React component library. Many libraries are available, but you should find one that suits your needs. You should also find a library that can grow and adapt…
Subscribe to our newsletter
Be the first to learn about new Sencha resources and tips.