


 Ask Sencha AI
Debugging Ext JS Applications using Visual Studio Code and Google Chrome
November 16, 2018
6945 Views
Get a summary of this article:
Two of the hottest development tools available to any web developer, Visual Studio Code (VSCode) and Google Chrome, seamlessly integrate to provide the most comprehensive debugging environment known to javascript. Gone are the days of console-log mazes – now is the time for stack traces and breakpoints in your javascript development environment. Read on to learn how to efficiently step through your Ext JS application, watch variables, check function scope, and resolve issues faster.
Preparing Your Environment
Installing VSCode
Getting started with VSCode is simple. Go here to review the installation process. It is highly recommended, from a workflow point of view, that you setup the ability to launch VSCode from the command. See the “Launching From the Command Line” section in the above link to the installation instructions for details on setting this up. Once done, you can simply run “code ” and watch VSCode open with ease. Since I’m often using terminal for different reasons, launching VSCode from here will save you mouse clicks, and therefore time.
Once you have VSCode installed, be sure to familiarize yourself with the Extension Marketplace. A variety of extensions are available to streamline workflows for VCS, debugging, and many more.
Extensions Setup
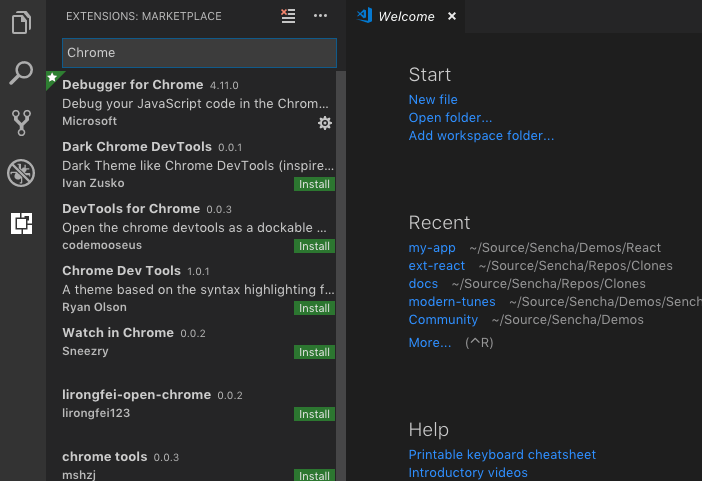
The Google Chrome Extension gives VSCode access to Chrome’s Developer Tools. Open the VSCode Marketplace and search for the Chrome extension (see below).
Click the install button and allow VSCode to download and complete the installation. Once finished, VSCode will prompt you to reload with a Reload button. After reloading the extensions, you will be ready to begin debugging. But wait…you need an app to debug right? If you already have an Ext JS application you want to test, you can skip to setting up a VSCode Debug Configuration.
Creating a Test Application Using Community Edition
With Ext JS Community Edition, you can easily generate an app to try your new debug environment. To get started with Community Edition sign up here, then follow the Getting Started Guide. This will walk you through generating a simple application we can use test our VSCode development environment.
All ready? It’s debug time.
VSCode Debug Configuration
Generating a Configuration
Debug configurations are created effortlessly. Simply click the debug icon in the Command Palette on the left side of your VSCode window. You will notice we aren’t given any debug configurations out of the box. To create a new one, click on the gear icon next to the configuration list, or select the list and choose “add configuration”.
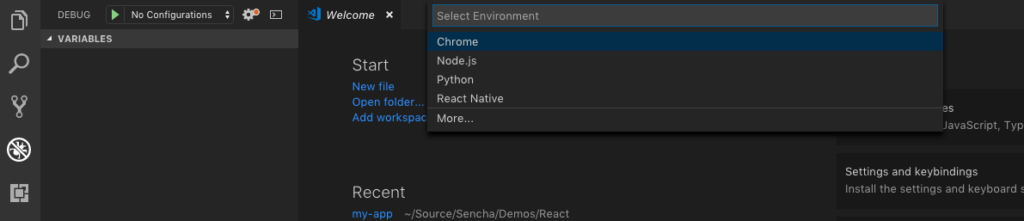
If you have properly installed the Chrome extension and reloaded VSCode you will see “Chrome” in the environment selection list (see the screenshot above). Choose Chrome to generate a new Chrome debug configuration.
Wiring Up the Configuration
We need to modify the generated configuration to both launch our application on a local web server and attach to the process so we can register breakpoints, etc.
- First, open a new terminal window in VSCode by selecting Terminal→ New Terminal from the VSCode menu. You will see a terminal window open at the root of your project.
- Next, enter “npm start” to launch your application.
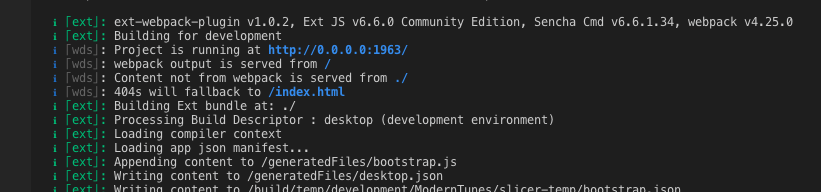
- Take note of the output in your terminal, particularly the line that says “Project is running at http://0.0.0.0:/”. This npm script will launch your app on localhost at a preset port. Copy the port and set the “url” value in the configuration to “http://localhost:”, replacing “” with just the port you observed from the terminal. For example, when I run “npm start”, I see the following:
At this point, your configuration should look something like this:
{
    "version": "0.2.0",
    "configurations": [
        {
            "type": "chrome",
            "request": "launch",
            "name": "Launch Chrome against localhost",
            "url": "http://localhost:1963",
            "webRoot": "${workspaceFolder}"
        }
    ]
}
Save your configuration with cmd+s or File → Save (called “launch.json” by default). Since we already started our app using “npm start”, we can choose our new debug configuration from the list and click the Start Debugging button to “attach” the VSCode debugger to the already running localhost server. Do this now and you’ll notice Chrome launches a new window or tab pointing to your app. You may have noticed that running “npm start” will open your default browser and point it to your app on localhost. If your default browser isn’t Chrome, you’ll end up with two different browsers rendering the same app or multiple Chrome tabs. We can do better.
Let’s remedy this by telling our configuration to both execute “npm start” AND attach our debug session. To do this, we’ll modify our configuration once again. Open launch.json and add the following preLaunchTask:
{
    "version": "0.2.0",
    "configurations": [
        {
            "type": "chrome",
            "request": "launch",
            "name": "Launch Chrome against localhost",
            "url": "http://localhost:1963",
            "webRoot": "${workspaceFolder}",
            "preLaunchTask": "npm start"
        }
    ]
}
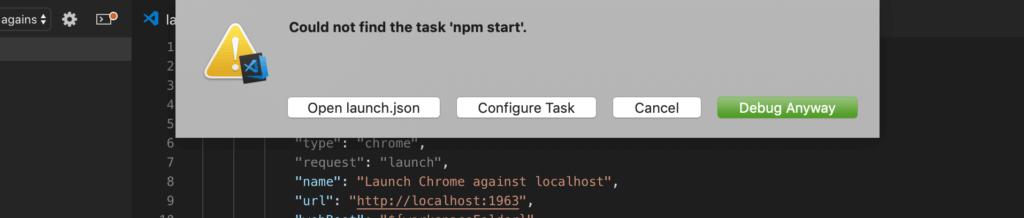
You’ll notice that we have a task defined, to be executed before we launch our Chrome debugging session. If we run this now, VSCode will inform us that it doesn’t know about the task. Let’s create it now.
Creating a Pre-launch Task
Running our debug configuration without having defined our task will result in VSCode informing us we can cancel, proceed, or create a new task. Go ahead and attempt to run your configuration again, but this time make sure you click the “configure task” button from the popover and then choose “npm: start” from the list of task options.
This will generate a new task.json for us. Add the following configuration:
{
	"version": "2.0.0",
	"tasks": [
		{
			"type": "npm",
			"script": "start",
			"group": {
				"kind": "test",
				"isDefault": true
			},
			"isBackground": true,
			"problemMatcher": {
				"owner": "custom",
				"pattern": {
					"regexp": "^$"
				},
				"background": {
					"activeOnStart": true,
					"beginsPattern": "Compiling...",
					"endsPattern": "Compiled .*"
				}
			}
		}
	]
}
Great work! Now that we have a task defined, we must go back to our launch.json to fix a typo! That’s right, this was a planned typo so we could take advantage of VSCode building the task for us. Lazy, I know. Open launch.json and make sure to add the “:” between “npm” and “start” inside the preLaunchTask configuration. Your launch.json should look something like this:
{
    "version": "0.2.0",
    "configurations": [
        {
            "type": "chrome",
            "request": "launch",
            "name": "Launch Chrome against localhost",
            "url": "http://localhost:1963",
            "webRoot": "${workspaceFolder}",
            "preLaunchTask": "npm: start" //Add the ':' right after npm here!
        }
    ]
}
We aren’t going to be digging into VSCode’s task configurations, but feel free to read through their docs here. It’s now time to begin debugging our Ext JS application.
Launching Your First Debug Session
Let’s begin our first debugging session now. Make sure you have ctl+c’d (killed) any existing “npm start” or other process that may have been running so we start with a clean slate. Once you’ve confirmed that no other processes that would interfere are still running, click the “start debugging”, green play button with your debug configuration selected and watch VSCode do it’s thing. You will notice a window will open in your default browser AND a debug Chrome instance launch. You can close the extra window in your default browser. Any success refreshes or launches of your debug configuration won’t open this window – they will keep reloading your debug instance of Chrome.
Using Breakpoints
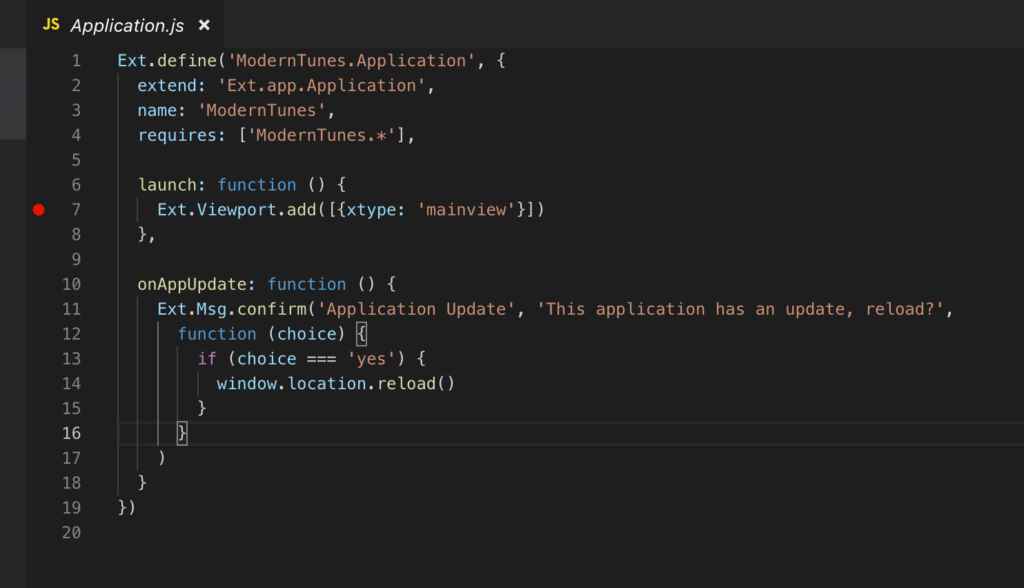
Navigate to and open up Application.js in VSCode. To the left of the line numbers (displayed by default) you will find a narrow column with nothing in it. Hovering over this column you’ll notice a red dot underneath your mouse cursor. Click inside the column on line 7 or inside the launch function like this:
Now, refresh your debug session. You will notice that Chrome tells us that a breakpoint has been hit in VSCode and provides us with minimal controls to step through our code. Switching back to VSCode is where the magic begins. Make sure the column between the Command Palette and the editor is visible by toggling the debug icon on the left. Near the bottom of this column you will see all of the breakpoints set. Use this to quickly enable / disable breakpoints without opening individual files or scrolling around.
Just above that section, you’ll see a section that breaks down which script has been loaded into your javascript context thus far. This is helpful as you can inspect your javascripts that are currently loaded, as well as any node modules, etc.
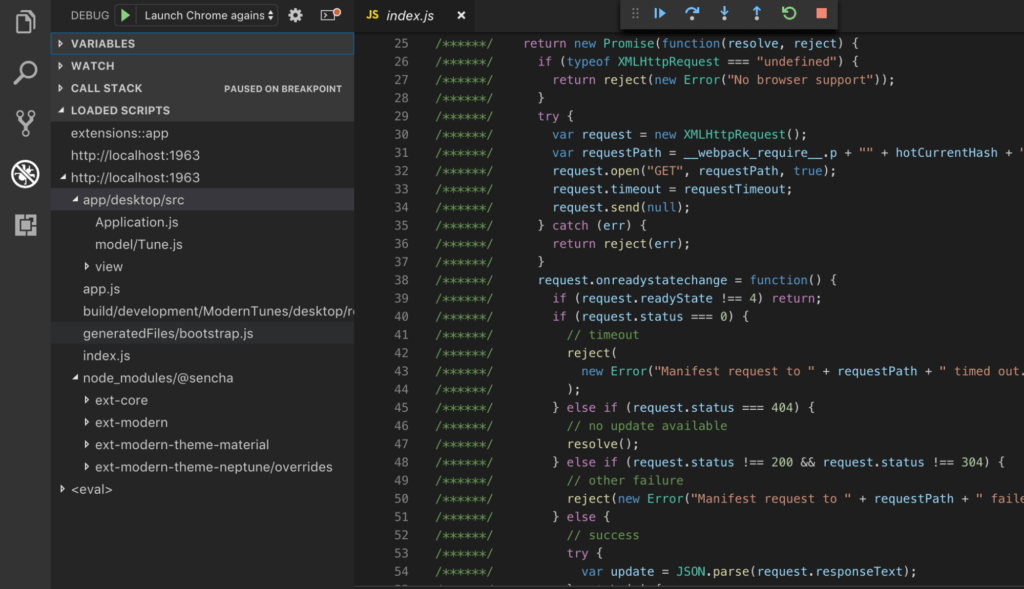
Viewing the Stack Trace
The Call Stack section allows interactive step through of, well, the stack of javascript executions leading up to your breakpoint. This is particularly helpful for tracking down the root cause of a bug or learning a new project architecture. Clicking on items within the Call Stack list will step you through the code, highlighting the specific line of code within the respective source file.
Setting Watches and Inspecting Variables and Scope
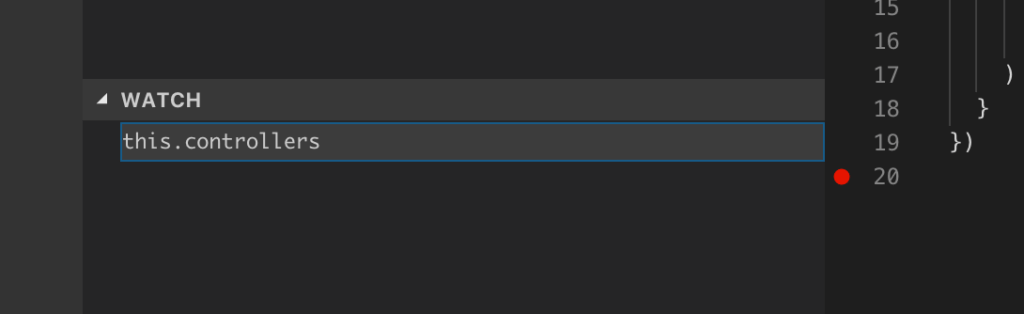
Since we have our breakpoint set in our launch function, let’s ‘watch’ our controllers get loaded. To set a basic watch, enter the name of a variable you wish to set a watch on. Using the variable inspector above, we can see we have a ‘this.controllers’ variable. Clicking the “+” button to the right of the Watch section header and entering ‘this.controllers’ into the expression field will create a watch on this variable.
Set an additional breakpoint at the bottom of Application.js, near line 20. This breakpoint will get hit as our application is loaded, before the controllers are initialized. Reload or restart your debug session and notice that this.controllers is empty. Stepping forward / over / or resuming past this breakpoint will take you to the the original breakpoint we had set, within the launch function. Here you will notice that now our controllers have been initialized and we can now inspect them in depth.
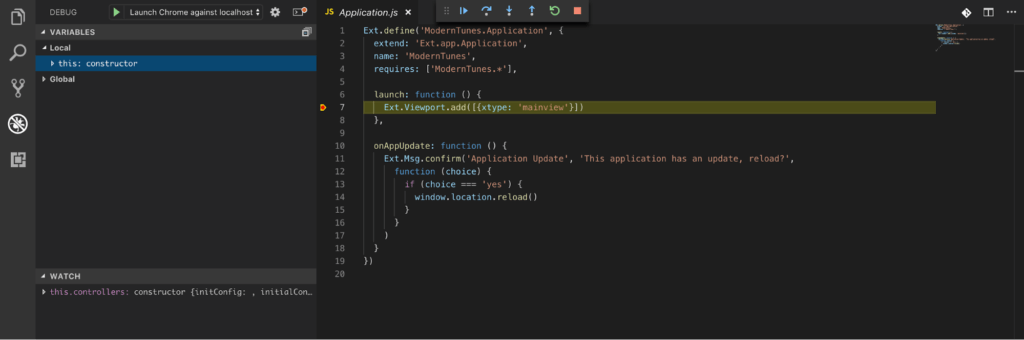
The Variables section provides us with a ‘scoped’ view of local and global variables. This is particularly helpful in understanding function scope, finding variable to set watches on, and checking the value of a global variable.
What’s Next?
The true benefit of using Chrome and VSCode for debugging your applications is that VSCode and Chrome ‘know’ of each other’s debugger settings, thanks to Chromes debug API. Think shared breakpoints, a breakpoint set in the Chrome debugger automatically registers with VSCode, and vice versa. This dramatically cleans up your Chrome window, as you don’t need to use all of the Chrome debug tools to interact with your application. Instead, you can rely on the information passed between both applications to consistently provide you with the right information and use each for its strong suits, like watching network traffic in the Chrome debugger and letting your IDE (VSCode) do the busy work of stepping through code. Of course, how you use each is entirely up to you.
Using the Sencha Visual Studio Code Plugin
For even better VSCode integration, install the Sencha Visual Studio Code Extension. This extension provides fast code completion and generation, just to name a few of it’s offerings.
Summary
Combining tools that work together often streamlines your work, reduces desktop clutter, and eliminates tabbing back and forth between different applications. This is what VSCode does best. Combine it with Chrome’s debugging capabilities, eliminate extra terminal commands to start and stop your application, and you will find yourself in a rich debugging environment that is highly customizable.You will also gain access to shared configurations that can be added to your source control and shared across teams (the entire .vscode directory), which enables fast introspection into your application environment and state.


Latest Content
7 JavaScript Frameworks That Actually Scale to Enterprise Workloads
While building software that can handle thousands of users, massive data pipelines, and complex business…
July 28, 2026

What Is the Best JavaScript Framework for Enterprise Applications in 2026?
In 2026, businesses are adopting newer technologies, dealing with evolving customer expectations, and facing challenges…
July 28, 2026

Open-Source vs Commercial Front-End Frameworks: When to Choose What
Imagine you are building a new headquarters for your company. You have two options to…
July 28, 2026


