


 Ask Sencha AI
Hidden Gems in Chrome Developer Tools
May 13, 2015
6568 Views
As a software developer building applications with web technology, I naturally spend lots of time in my browser. For many years web developers struggled to build cross-browser applications because many browsers (notably older versions of Internet Explorer) failed to offer even minimal debugging tools — but thankfully today every browser ships with helpful developer tools and support modern standards. These can be especially useful when working with a javascript web framework.
I use Google Chrome as my primary browser simply because its set of developer tools offers more features than the competition. I often joke that Chrome Developer Tools has so many features that they ran out of space to show them, so I wanted to share a few hidden gems I’ve found.
A Quick History Lesson
Google Chrome was first released in 2008. At that time, web developers didn’t have many options when it came to choosing even the most basic debugging tools — Internet Explorer did not offer any developer tools (in spite of holding the majority of the worldwide browser market share), and Safari and Firefox only offered limited tooling. Firebug (an extension for Firefox) was by far the most advanced tool available, and many of us relied on it.
But after Chrome was released, this picture quickly began to change. Chrome (at that time) extended WebKit and the built-in “WebKit Inspector” to include a variety of additional tools (like Profiles) — and soon thereafter surpassed the feature set of Firebug.
Today, Google pushes a new version of Chrome every six weeks, and these updates often include changes to the Chrome Developer Tools. At that cadence, it becomes difficult to stay on top of new features or UI changes.
Hidden Gems
When I spoke about this topic at SenchaCon some time ago, I skipped what I considered to be the “basic” features of Chrome Developer Tools in order to spend more time talking about the advanced and hidden features. Chrome DevTools has what seems like 10,000 individual features, and we could literally spend days talking about them — so let’s jump right into three features I have found incredibly helpful.
Layers Panel
Although most web developers conceptually understand how nesting DOM elements affects the way the browser layers CSS is applied to those elements, the fact remains that the browser displays a 2D plane. However, Chrome DevTools has a feature that allows us to view the DOM layering in 3D.
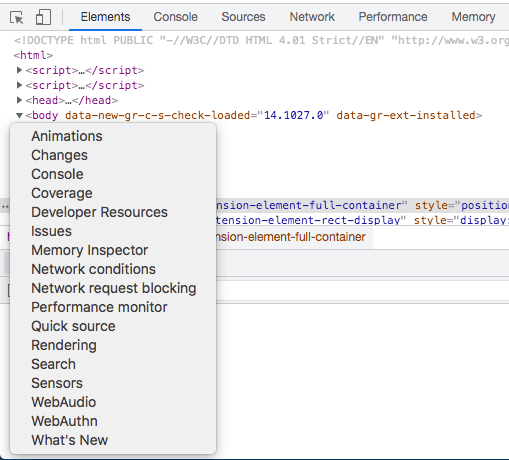
To access this feature, click on the three dots menu on the right/top side, then More tools then enable Layers option:
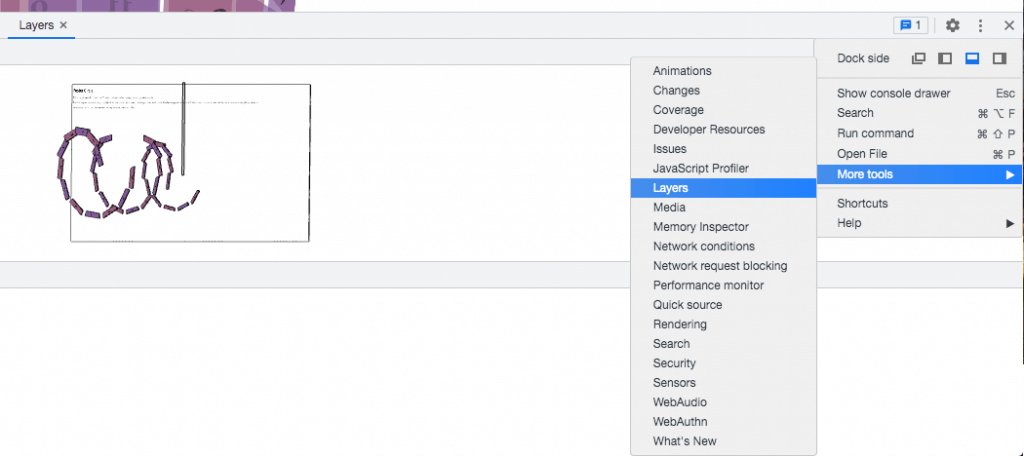
Now you should see the Layers tab:
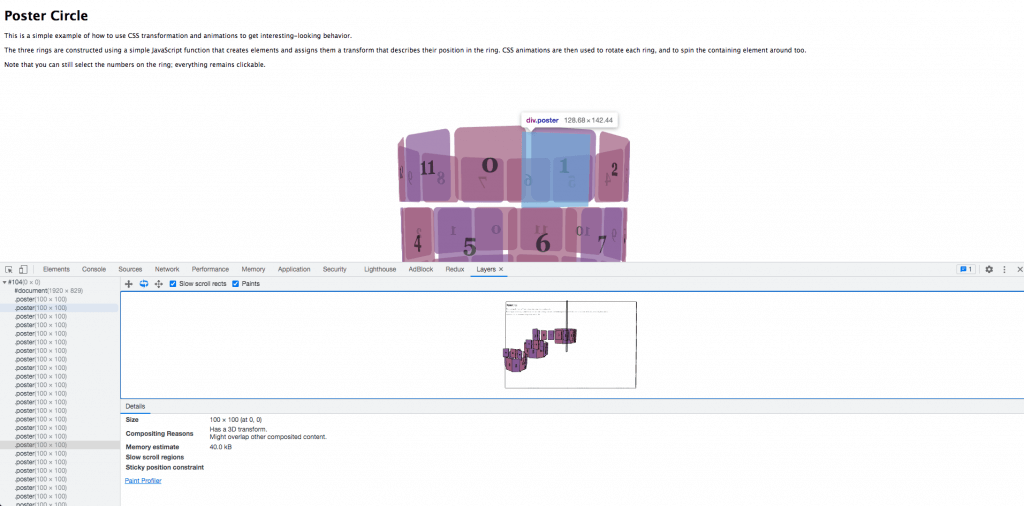
The Layers panel can be incredibly helpful in understanding how your DOM elements are structured on the page, and therefore how CSS rules may apply to them. It’s also very helpful in building anything involving CSS 3D Transforms.
ESC Drawer
Sencha applications are notoriously different from web apps built with other frameworks in that Sencha applications generally involve writing very little HTML. Therefore, we tend to spend the majority of our time in the Sources tab debugging JavaScript at runtime. However, it becomes inconvenient to set breakpoints on the Sources tab, then switch to the Console tab to interact with the scope variables, then switch back to Sources (and so on).
Thankfully, Chrome DevTools offers a hidden feature to open the Console on any tab.
To show it, simply hit the ESC key and the ESC drawer magically opens from the bottom:
The ESC Drawer allows you simultaneous access to the Console, which is certainly convenient — but it also does a whole lot more! The “Performance monitor” and “Rendering” and many other tabs accessible by left three dots menu, are full of amazing features that you should explore:
Asynchronous Call Stacks
Few things in JavaScript can be as frustrating as debugging code inside of the callback of an AJAX request. Depending on how your code is written, the scope of the callback may be set to the window object — and even worse, you might hit an error and have no idea how your runtime got to that point in the first place.
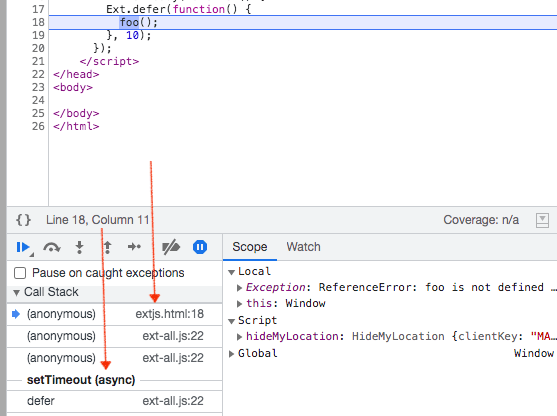
In the example above, we hit a runtime error complaining that foo() is not defined. We can pause on the caught exception and see which line of code throws the error and you’ll be given a comprehensive call stack that tells you from where an asynchronous callback was executed.
Conclusion
Google continues to innovate and create exceptional tools for building amazing web applications. With a little bit of exploration, you’ll find a treasure trove of additional debugging functionality in Chrome Developer Tools that you may not have realized existed!
Do you have a favorite feature? Share yours in the comments below.
 1
1

Latest Content
4 Low-Code Software Development Platforms Ranked by Scalability
By 2026, Gartner says 80% of apps will be built using low code tools. That’s…
July 17, 2025

7 Software Development Platforms Every Startup Should Evaluate in 2025
Did you know that nearly 90% of startups fail? And one of the biggest reasons…
July 14, 2025
What’s New in Rapid Ext JS 1.1.1
The Sencha team is excited to announce the latest Sencha Rapid Ext JS 1.1.1 release…
July 8, 2025


