


 Ask Sencha AI
How To Build Powerful Data Visualizations Using JavaScript with D3 in Sencha Ext JS
April 14, 2021
5547 Views
Get a summary of this article:
The D3 package in Sencha Ext JS is a very popular and efficient way to visualize data. There are 2 main components to the tool — the first is D3, the powerful JavaScript library that helps you easily visualize data on the web using HTML tables or SVG. Next is Ext JS, the Sencha JavaScript framework for building interactive cross-platform applications.
By using D3 with Ext JS, you can build powerful data visualizations that help organizations and individuals uncover valuable insights by seeing their data more effectively. If effective, intuitive, and easy-to-implement data visualization is what you are after, read on to learn more about how you can put Ext JS and D3 to work for you.
What is D3?
First off, you ask, what is D3? D3 stands for Data-Driven Documents. It is an open-source JavaScript library for producing dynamic, readable, and interactive data visualizations in web browsers. It uses all the modern web standards, including SVG, HTML, and CSS.
What makes it effective is that you can use D3 to bind any arbitrary data to your Document Object Model (DOM) and apply data transformations from there. D3 is incredibly flexible. For example, you can use D3 to generate an HTML table from any array of numbers. You can also use D3 to create an interactive SVG bar chart using the same data.
In short, D3 lets you present your information in a visually appealing way. There is also support for a D3 heat map. More importantly, it gives you full control over the data selection process.
What are Three Reasons to use D3 for data visualization?
There are many reasons why Sencha’s D3 is the perfect tool to visualize your data. but for now, let’s stick to these 3:
- It’s easy to build any kind of visualization that you want. The D3 library lets you present your complex numbers in a way that is easy for everyone to read. You can easily generate reports, it simplifies making comparisons and allows you to present your data that makes it easier to recognize patterns.
- It’s simple to reuse code and add specific functions. D3 is a JavaScript library with functional styles built in. As a result, creating attractive, powerful data visualization is a breeze.
- It creates memorable visualizations. Data Visualizations created with D3 stand out. Whether you are working to convince investors or present findings, nothing works better than properly transformed data to uncover valuable insights.
How can I Build Powerful Data Visualizations with D3 and Ext JS?
The Sencha D3 package is completely integrated with Ext JS. The result is powerful, easily implemented data visualizations. The D3 package supports multiple component types, including Hierarchical Components, Heatmap Components, and Custom Components. Here we will look at the details of integrating the hierarchical “Sunburst” and “Zoomable Sunburst” components in Ext JS.
What about a Sunburst?
The D3 sunburst component is a dynamic and compelling way to render your hierarchical data. Like a sunburst, it visualizes tree nodes as concentric wedge sectors, with the root circle in the center. It opens outward for every level of depth in the hierarchy.
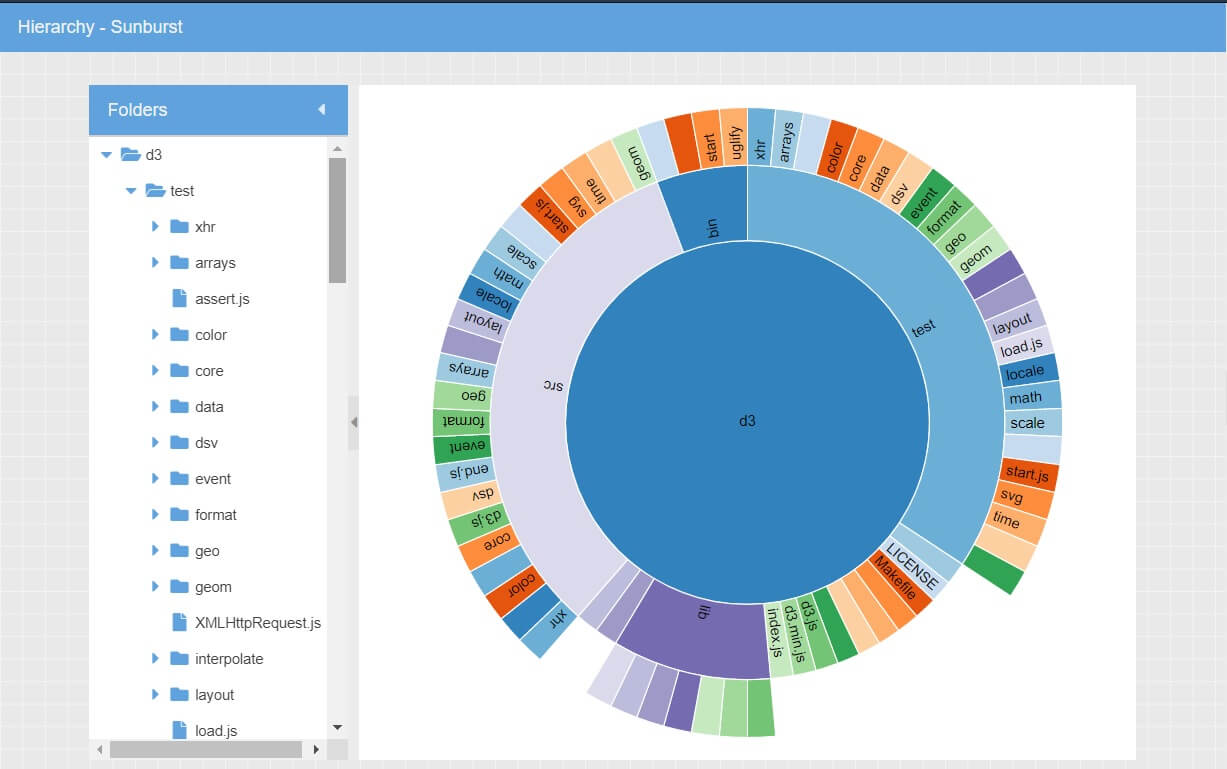
To produce the visualization shown above, you have to create the Model by using the following code:
Ext.define('KitchenSink.model.Tree', {
extend: 'Ext.data.TreeModel',
fields: [
'name',
'path',
'size',
{
name: 'leaf',
calculate: function(data) {
return data.root ? false : !data.children;
}
},
{
name: 'text',
calculate: function(data) {
return data.name;
}
}
],
proxy: {
type: 'ajax',
url: 'data/tree/tree.json'
},
idProperty: 'path'
});
Next, you have to create the Controller.
Ext.define('KitchenSink.view.d3.SunburstController', {
extend: 'Ext.app.ViewController',
alias: 'controller.sunburst',
requires: [
'Ext.util.Format'
],
onTooltip: function(component, tooltip, node, element, event) {
var record = node.data,
size = record.get('size'),
n = record.childNodes.length;
tooltip.setTitle(record.get('text'));
if (size) {
tooltip.setHtml(Ext.util.Format.fileSize(size));
}
else {
tooltip.setHtml(n + ' file' + (n === 1 ? '' : 's') + ' inside.');
}
}
});
Add the following code to create the View.
Ext.define('KitchenSink.view.d3.Sunburst', {
extend: 'Ext.panel.Panel',
xtype: 'd3-view-sunburst',
controller: 'sunburst',
requires: [
'KitchenSink.view.d3.TreeViewModel',
'Ext.d3.hierarchy.partition.Sunburst'
],
width: 930,
height: 600,
layout: 'border',
viewModel: {
type: 'tree'
},
items: [
{
xtype: 'treepanel',
region: 'west',
split: true,
splitterResize: false,
collapsible: true,
minWidth: 100,
width: 230,
title: 'Folders',
useArrows: true,
displayField: 'name',
bind: {
store: '{store}',
selection: '{selection}',
focused: '{selection}'
}
},
{
region: 'center',
xtype: 'panel',
layout: 'fit',
items: {
xtype: 'd3-sunburst',
reference: 'd3',
padding: 20,
bind: {
store: '{store}',
selection: '{selection}'
},
tooltip: {
renderer: 'onTooltip'
}
}
}
]
});
Keep in mind that the angle and area of each section of the above visualization correspond to this node value:
viewModel: {
type: 'tree'
}
Finally, you have to add the View Model.
Ext.define('KitchenSink.view.d3.TreeViewModel', {
extend: 'Ext.app.ViewModel',
requires: [
'KitchenSink.model.Tree',
'Ext.data.TreeStore'
],
alias: 'viewmodel.tree',
stores: {
store: {
type: 'tree',
defaultRootText: 'd3',
model: 'KitchenSink.model.Tree',
autoLoad: true
}
},
data: {
selection: undefined
}
});
By default, the same node value mentioned in the View, which is type: ‘tree’, is returned for each node. So, the siblings will optionally span an equal amount of angles.
To see it for your self check out our D3 Sunburst demo here.
What about a Zoomable Sunburst?
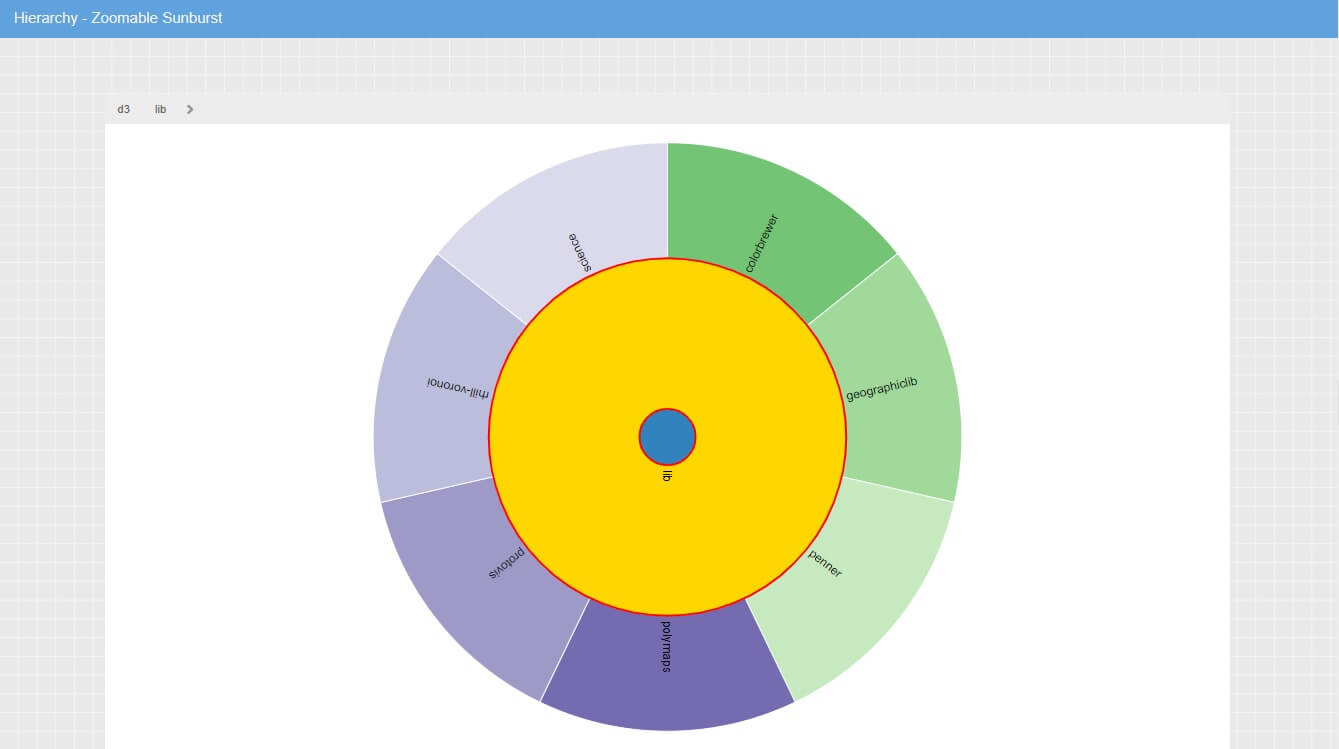
Next, taking the Sunburst a step further, the Zoomable Sunburst component shows only two levels of the Sunburst hierarchy at a time but uses transitions to lets you zoom in on the subtree or selected node. As an example, take a look at the examples below. Each diagram shows a different level of the Zoomable Sunburst:
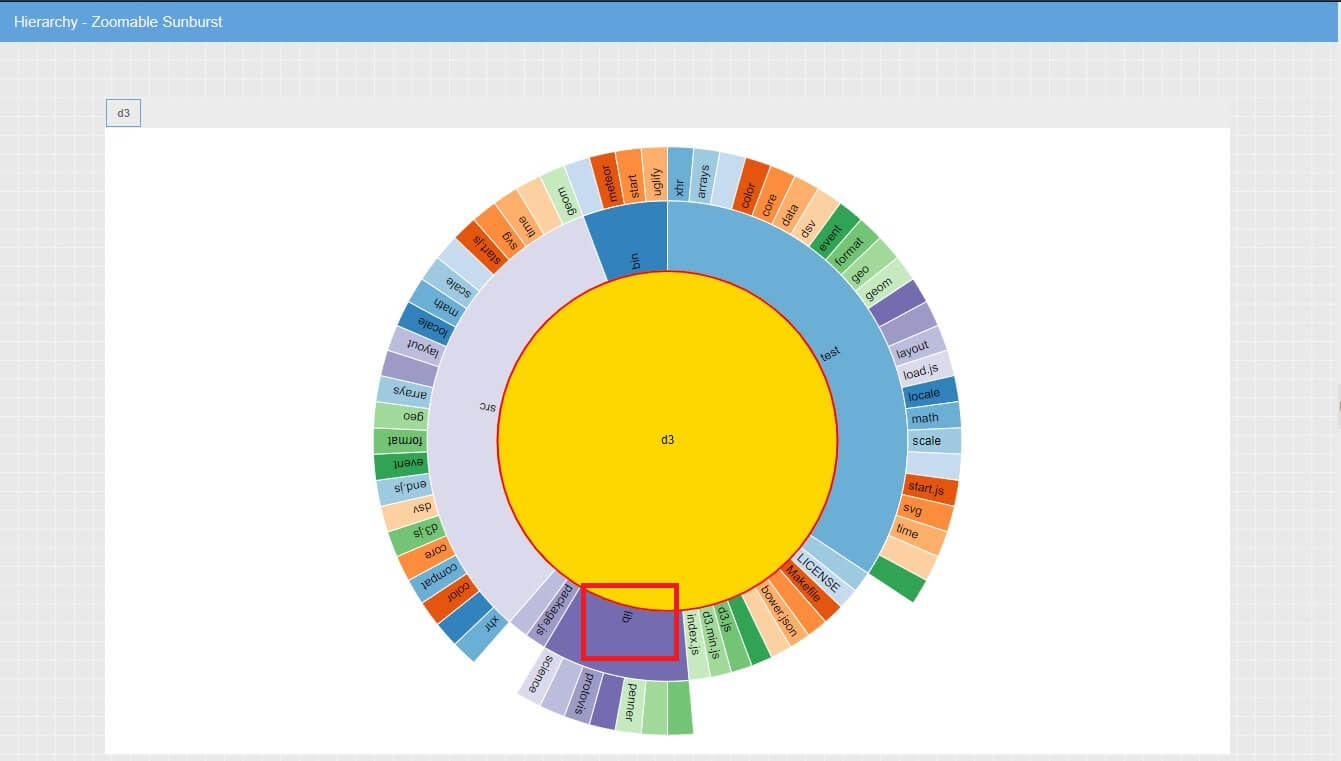
You can click on any node to zoom in and reveal more data.
To produce the visualization shown above, you have to create the Model:
Ext.define('KitchenSink.model.Tree', {
extend: 'Ext.data.TreeModel',
fields: [
'name',
'path',
'size',
{
name: 'leaf',
calculate: function(data) {
return data.root ? false : !data.children;
}
},
{
name: 'text',
calculate: function(data) {
return data.name;
}
}
],
proxy: {
type: 'ajax',
url: 'data/tree/tree.json'
},
idProperty: 'path'
});
Now, you have to create the View.
Ext.define('KitchenSink.view.d3.SunburstZoom', {
extend: 'Ext.panel.Panel',
xtype: 'd3-view-sunburst-zoom',
controller: 'sunburst-zoom',
requires: [
'KitchenSink.view.d3.TreeViewModel',
'Ext.d3.hierarchy.partition.Sunburst'
],
width: 1200,
height: 700,
layout: 'border',
viewModel: {
type: 'tree'
},
items: [
{
xtype: 'breadcrumb',
region: 'north',
bind: {
store: '{store}',
selection: '{selection}'
},
publishes: 'selection'
},
{
region: 'center',
xtype: 'panel',
layout: 'fit',
items: {
xtype: 'd3-sunburst',
reference: 'd3',
padding: 20,
bind: {
store: '{store}',
selection: '{selection}'
},
transitions: {
select: false
},
listeners: {
selectionchange: 'onSelectionChange'
},
expandEventName: false
}
}
]
});
Then, you have to create the Controller.
Ext.define('KitchenSink.view.d3.SunburstZoomController', {
extend: 'Ext.app.ViewController',
alias: 'controller.sunburst-zoom',
onSelectionChange: function(sunburst, node) {
sunburst.zoomInNode(node);
}
});
Finally, you have to create the View Model.
Ext.define('KitchenSink.view.d3.TreeViewModel', {
extend: 'Ext.app.ViewModel',
requires: [
'KitchenSink.model.Tree',
'Ext.data.TreeStore'
],
alias: 'viewmodel.tree',
stores: {
store: {
type: 'tree',
defaultRootText: 'd3',
model: 'KitchenSink.model.Tree',
autoLoad: true
}
},
data: {
selection: undefined
}
});
Take a look at the D3 Zoomable Sunburst Demo here.
Are you ready to get started with D3?
That’s pretty much it! As you can see, visualizing your data with D3 is fast and simple. If you are interested in more great ways to create interactive data visualizations using JavaScript in Sencha Ext JS, keep in touch. Or, better yet, check out the demo.


Latest Content

12 Best Application Development Software Tools for Enterprise Teams in 2026
Enterprise teams in 2026 build applications using a stack of complementary application development software tools…
July 16, 2026

7 Best React Data Grids in 2026: Performance, Features, and Pricing Compared
React data grid selection significantly affects enterprise application development outcomes because grids are often the…
July 16, 2026

Front-End Frameworks for Banks and Financial Institutions: A 2026 Guide
Banks and financial institutions face front-end framework choices that affect application performance, security, regulatory compliance,…
July 15, 2026


