


 Ask Sencha AI
How To Visualize Data With D3 And JavaScript Using Treemaps, Heatmaps, And Pivot Heatmaps
May 27, 2021
4525 Views
Get a summary of this article:
The D3 package in Sencha Ext JS boasts several powerful components. By utilizing them, you can create amazing data visualizations that can help your business uncover valuable insights both easily and conveniently. In this post, we will discuss three of the most useful Ext JS native components: Treemap, Heatmap, and Pivot Heatmap.
Let’s dive in.
What is D3?
D3 (Data Driven Components) is a powerful JavaScript library. It enables you to produce dynamic and interactive data visualizations in the web browser, utilizing modern web standards. These standards include SVG, HTML, and CSS. Best of all, D3 is open-source, so you can use it without spending a single penny.
How do I Visualize Data Using D3 and JavaScript?
Because the Sencha D3 JavaScript package is fully integrated with Ext JS, you can create powerful data visualizations and implement them into your Ext JS web applications with ease. Although there are many different component types in the D3 package, in this post, we will discuss only Treemaps, the D3 Heat map, and Pivot Heatmaps.
D3 Treemap
The D3-treemap is a powerful component that recursively subdivides areas into rectangles, where the area of any node in a tree corresponds to its comparative value.
Let’s take a look at this example:

To create the visualization shown above, simply follow these steps:
1. First, you have to create the model:
Ext.define('KitchenSink.model.Stock', {
extend: 'Ext.data.TreeModel',
fields: [
'name',
'description',
'cap',
{
name: 'leaf',
calculate: function(data) {
return data.root ? false : !data.children;
}
},
{
name: 'change',
calculate: function() {
return (-5 + Math.random() * 10).toFixed(2); // percentages
}
},
{
name: 'expanded',
type: 'boolean',
defaultValue: true
}
],
proxy: {
type: 'ajax',
url: 'data/tree/stocks.json'
}
});
Here, you are adding different fields, including name, field, description, leaf, and change.
2. Next, you have to create the View. To do so, add the following code:
Ext.define('KitchenSink.view.d3.TreeMap', {
extend: 'Ext.panel.Panel',
xtype: 'd3-view-treemap',
controller: 'treemap',
requires: [
'KitchenSink.view.d3.StocksViewModel',
'Ext.d3.hierarchy.TreeMap'
],
width: 930,
height: 600,
profiles: {
classic: {
width: 930,
companyPanelWidth: 215
},
neptune: {
width: 930,
companyPanelWidth: 215
},
graphite: {
width: 1000,
companyPanelWidth: 300
},
'classic-material': {
width: 1000,
companyPanelWidth: 300
}
},
layout: 'border',
viewModel: {
type: 'stocks'
},
items: [
{
xtype: 'treepanel',
region: 'west',
title: 'Companies',
split: true,
splitterResize: false,
collapsible: true,
minWidth: 100,
width: 215,
useArrows: true,
displayField: 'name',
rootVisible: false,
bind: {
store: '{store}',
selection: '{selection}',
focused: '{selection}'
},
tbar: {
xtype: 'segmentedbutton',
width: '100%',
items: [
{
text: 'Market Cap',
pressed: true
},
{
text: 'Uniform'
}
],
listeners: {
toggle: 'onNodeValueToggle'
}
}
},
{
xtype: 'panel',
region: 'center',
layout: 'fit',
items: {
xtype: 'd3-treemap',
reference: 'treemap',
rootVisible: false,
interactions: {
type: 'panzoom',
zoom: {
doubleTap: false
}
},
bind: {
store: '{store}',
selection: '{selection}'
},
nodeValue: 'cap',
noParentValue: true,
scaleLabels: true,
colorAxis: {
scale: {
type: 'linear',
domain: [-5, 0, 5],
range: ['#E45649', '#ECECEC', '#50A14F']
},
field: 'change',
processor: function(axis, scale, node, field) {
var record = node.data;
return record.isLeaf() ? scale(record.get(field)) : '#ececec';
}
}
}
}
]
});
3. Once you are don there, you have to create the View Model:
Ext.define('KitchenSink.view.d3.StocksViewModel', {
extend: 'Ext.app.ViewModel',
requires: [
'KitchenSink.model.Tree',
'Ext.data.TreeStore'
],
alias: 'viewmodel.stocks',
stores: {
store: {
type: 'tree',
model: 'KitchenSink.model.Stock',
autoLoad: true
}
},
data: {
selection: undefined
}
});
4. Finally, you have to create the Controller using this code snippet:
Ext.define('KitchenSink.view.d3.TreeMapController', {
extend: 'Ext.app.ViewController',
alias: 'controller.treemap',
onNodeValueToggle: function(segmentedButton, button, pressed) {
var treemap = this.lookupReference('treemap'),
value = segmentedButton.getValue();
treemap.setNodeValue(value || 'cap');
}
});
To see more, you can take a look at the demo right here.
D3 Heatmap
With the Sencha Ext JS D3-heatmap component, you can effectively visualize complex data like multidimensional arrays. You can use heatmaps to visualize matrices where the individual values are represented as colors. Take a look at this example:

To create the heatmap shown above, follow these steps:
1. Create the view using these lines:
Ext.define('KitchenSink.view.d3.heatmap.Pivot', {
extend: 'Ext.panel.Panel',
xtype: 'd3-view-heatmap-pivot',
controller: 'heatmap-pivot',
requires: [
'KitchenSink.view.d3.heatmap.PivotController',
'Ext.pivot.d3.HeatMap'
],
width: 960,
height: 600,
layout: 'fit',
resizable: true,
items: {
xtype: 'pivotheatmap',
reference: 'heatmap',
// pivot matrix configurations
matrix: {
store: {
type: 'salesperemployee'
},
leftAxis: {
dataIndex: 'employee',
header: 'Employee',
sortable: false
},
topAxis: {
dataIndex: 'day',
sortIndex: 'dayNumber',
header: 'Day'
},
aggregate: {
dataIndex: 'sales',
aggregator: 'sum'
}
},
padding: {
top: 20,
right: 30,
bottom: 70,
left: 120
},
xAxis: {
title: {
attr: {
'font-size': '14px'
}
}
},
yAxis: {
title: {
attr: {
'font-size': '14px'
}
}
},
colorAxis: {
scale: {
type: 'linear',
range: ['#ffffd9', '#49b6c4', '#225ea8']
}
},
legend: {
docked: 'right',
padding: 50,
items: {
count: 10,
slice: [1],
reverse: true,
size: {
x: 60,
y: 30
}
}
},
tooltip: {
renderer: 'onTooltip'
}
},
tbar: [
'->',
{
text: 'Refresh Data',
handler: 'onRefreshData'
}
]
});
Here, you are configuring the pivot matrix. Also, you are defining axis, legends, and tooltips.
2. Now, you have to create the Controller. Add this code to make it happen:
Ext.define('KitchenSink.view.d3.heatmap.PivotController', {
extend: 'Ext.app.ViewController',
alias: 'controller.heatmap-pivot',
changeDock: function(button, checked) {
if (checked) {
this.getView().getConfigurator().setDock(button.text.toLowerCase());
}
},
monthLabelRenderer: function(v) {
return Ext.Date.monthNames[v];
},
onRefreshData: function() {
var me = this,
heatmap = me.lookupReference('heatmap'),
store = heatmap.getMatrix().store;
store.refreshRandomData(100);
},
onBeforeAddConfigField: function(panel, config) {
var dest = config.toContainer;
if (dest.getFieldType() !== 'all' && dest.items.getCount() >= 1) {
// this will force single fields on both axis and aggregate
dest.removeAll();
}
},
onShowFieldSettings: function(panel, config) {
var align = config.container.down('[name=align]');
// hide the alignment field in settings since it's useless
if (align) {
align.hide();
}
},
onTooltip: function(component, tooltip, datum, element, event) {
var d = datum.data,
x = component.getXAxis().getField(),
y = component.getYAxis().getField(),
z = component.getColorAxis().getField();
tooltip.setHtml(
'<div>X: ' + d + '</div>' +
'<div>Y: ' + d[y] + '</div>' +
'<div>Z: ' + d[z] + '</div>' +
'<div>Records: ' + d.records + '</div>'
);
}
});
3. Once you are done there, create a new file, called “Store.” Add these lines:
Ext.define('KitchenSink.store.SalesPerEmployee', {
extend: 'Ext.data.Store',
alias: 'store.salesperemployee',
fields: [
{ name: 'employee', type: 'string' },
{ name: 'dayNumber', type: 'int' },
{ name: 'day', type: 'string' },
{ name: 'sales', type: 'number' }
],
employees: [
'Adrian',
'Alex',
'Kevin',
'Nige',
'Phil',
'Simon',
'Don',
'Mike',
'Ross',
'Vitaly'
],
days: [
'Monday',
'Tuesday',
'Wednesday',
'Thursday',
'Friday'
],
generateData: function(iCount, jCount) {
var me = this,
data = [],
min = 20,
delta = 20 + Math.floor(Math.random() * 260),
i, j;
iCount = iCount || me.employees.length;
jCount = jCount || me.days.length;
for (i = 0; i < iCount; i++) {
for (j = 0; j < jCount; j++) {
data.push({
employee: me.employees,
dayNumber: j,
day: me.days[j],
sales: min + Math.floor(Math.random() * delta)
});
}
}
return data;
},
refreshData: function() {
this.setData(this.generateData());
},
refreshDataAndSize: function() {
var minSize = 1;
this.setData(this.generateData(
minSize + Math.round(Math.random() * (this.employees.length - minSize)),
minSize + Math.round(Math.random() * (this.days.length - minSize))
));
},
getRandomInt: function(min, max) {
return Math.floor(Math.random() * (max - min + 1)) + min;
},
randomItem: function(data) {
var k = this.getRandomInt(0, data.length - 1);
return data[k];
},
refreshRandomData: function(size) {
var me = this,
data = [],
delta = 20 + Math.floor(Math.random() * 260),
i, day;
size = size || 500;
for (i = 0; i < size; i++) {
day = me.randomItem(me.days);
data.push({
employee: me.randomItem(me.employees),
dayNumber: Ext.Array.indexOf(me.days, day),
day: day,
sales: 20 + Math.floor(Math.random() * delta)
});
}
this.setData(data);
},
constructor: function(config) {
config = Ext.apply({
data: this.generateData()
}, config);
this.callParent([config]);
}
});
In the code above, you are adding different fields, including employee, day, and sales. Also, you are defining functions for generating the data.
Want to see more? You can find the demo here.
D3 Pivot Heatmap
The ‘pivot-D3-heatmap’ extends the D3 Heatmap to work with the pivot matrix. To integrate the D3 Heatmap with the pivot matrix easily, take a look at this example:
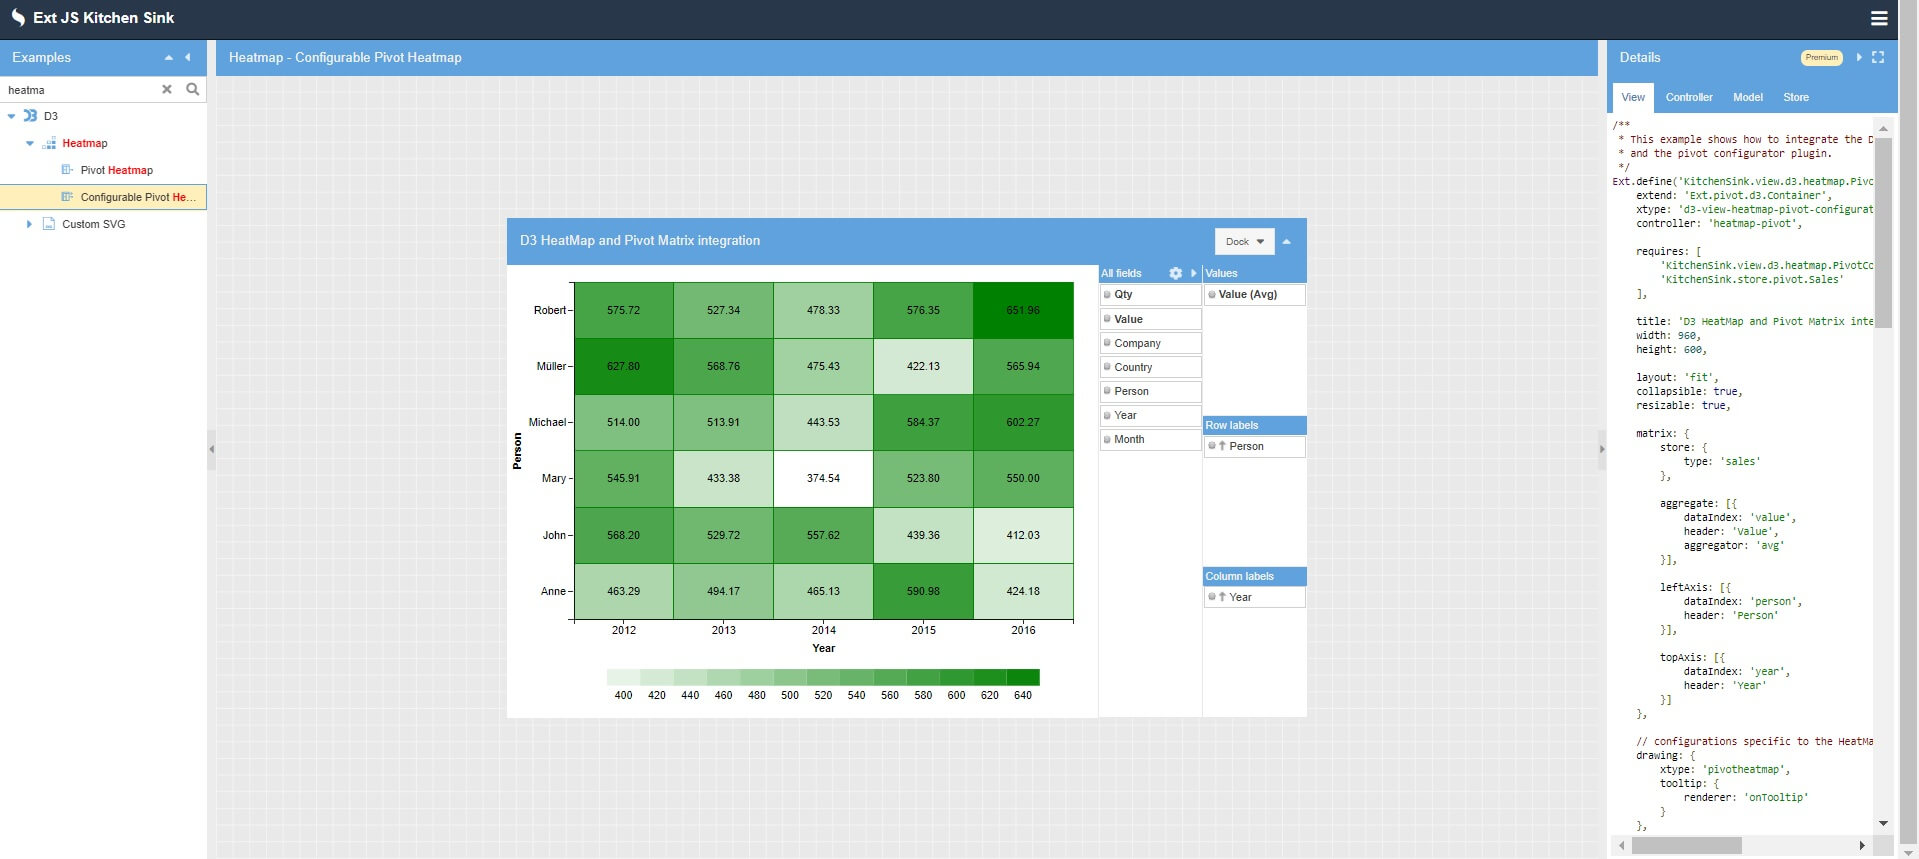
To create this visualization, you have to go through these steps:
1. First, you have to create the model:
Ext.define('KitchenSink.model.pivot.Sale', function() {
var regions = {
"Belgium": 'Europe',
"Netherlands": 'Europe',
"United Kingdom": 'Europe',
"Canada": 'North America',
"United States": 'North America',
"Australia": 'Australia'
};
return {
extend: 'KitchenSink.model.Base',
fields: [
{ name: 'id', type: 'int' },
{ name: 'company', type: 'string' },
{ name: 'country', type: 'string' },
{ name: 'person', type: 'string' },
{ name: 'date', type: 'date', dateFormat: 'c' },
{ name: 'value', type: 'float', allowNull: true },
{ name: 'quantity', type: 'float', allowNull: true },
{
name: 'year',
calculate: function(data) {
return parseInt(Ext.Date.format(data.date, "Y"), 10);
}
}, {
name: 'month',
calculate: function(data) {
return parseInt(Ext.Date.format(data.date, "m"), 10) - 1;
}
}, {
name: 'continent',
calculate: function(data) {
return regions[data.country];
}
}
]
};
});
Here, you are adding different fields, like company, country, and person. Also, you are adding different functions for calculating year and month.
2. Now, you have to add the views:
Ext.define('KitchenSink.view.d3.heatmap.PivotConfigurator', {
extend: 'Ext.pivot.d3.Container',
xtype: 'd3-view-heatmap-pivot-configurator',
controller: 'heatmap-pivot',
requires: [
'KitchenSink.view.d3.heatmap.PivotController',
'KitchenSink.store.pivot.Sales'
],
title: 'D3 HeatMap and Pivot Matrix integration',
width: 960,
height: 600,
layout: 'fit',
collapsible: true,
resizable: true,
matrix: {
store: {
type: 'sales'
},
aggregate: [{
dataIndex: 'value',
header: 'Value',
aggregator: 'avg'
}],
leftAxis: [{
dataIndex: 'person',
header: 'Person'
}],
topAxis: [{
dataIndex: 'year',
header: 'Year'
}]
},
// configurations specific to the HeatMap component
drawing: {
xtype: 'pivotheatmap',
tooltip: {
renderer: 'onTooltip'
}
},
// configurations specific to the pivot configurator plugin
configurator: {
// It is possible to configure a list of fields that can be used to
// configure the pivot matrix. If no fields list is supplied then all
// fields from the Store model are fetched automatically
fields: [{
dataIndex: 'quantity',
header: 'Qty',
// You can even provide a default aggregator function to be used
// when this field is dropped on the agg dimensions
aggregator: 'sum',
formatter: 'number("0")',
settings: {
// Define here in which areas this field could be used
allowed: ['aggregate'],
// Set a custom style for this field to inform the user that it can
// be dragged only to "Values"
style: {
fontWeight: 'bold'
},
// Define here custom formatters that can be used on this dimension
formatters: {
'0': 'number("0")',
'0%': 'number("0%")'
}
}
}, {
dataIndex: 'value',
header: 'Value',
settings: {
// Define here in which areas this field could be used
allowed: 'aggregate',
// Define here what aggregator functions can be used when this field is
// used as an aggregate dimension
aggregators: ['sum', 'avg', 'count'],
// Set a custom style for this field to inform the user that it can be
// dragged only to "Values"
style: {
fontWeight: 'bold'
},
// Define here custom formatters that ca be used on this dimension
formatters: {
'0': 'number("0")',
'0.00': 'number("0.00")',
'0,000.00': 'number("0,000.00")',
'0%': 'number("0%")',
'0.00%': 'number("0.00%")'
}
}
}, {
dataIndex: 'company',
header: 'Company',
settings: {
// Define here what aggregator functions can be used when this field is
// used as an aggregate dimension
aggregators: ['count']
}
}, {
dataIndex: 'country',
header: 'Country',
settings: {
// Define here what aggregator functions can be used when this field is
// used as an aggregate dimension
aggregators: ['count']
}
}, {
dataIndex: 'person',
header: 'Person',
settings: {
// Define here what aggregator functions can be used when this field is
// used as an aggregate dimension
aggregators: 'count'
}
}, {
dataIndex: 'year',
header: 'Year',
settings: {
// Define here in which areas this field could be used
allowed: ['leftAxis', 'topAxis']
}
}, {
dataIndex: 'month',
header: 'Month',
labelRenderer: 'monthLabelRenderer',
settings: {
// Define here in which areas this field could be used
allowed: ['leftAxis', 'topAxis']
}
}]
},
listeners: {
beforemoveconfigfield: 'onBeforeAddConfigField',
showconfigfieldsettings: 'onShowFieldSettings'
},
header: {
itemPosition: 1, // after title before collapse tool
items: [{
ui: 'default-toolbar',
xtype: 'button',
cls: 'dock-tab-btn',
text: 'Dock',
menu: {
defaults: {
xtype: 'menucheckitem',
group: 'docking',
checkHandler: 'changeDock'
},
items: [{
text: 'Top'
}, {
text: 'Right',
checked: true
}, {
text: 'Bottom'
}, {
text: 'Left'
}]
}
}]
}
});
Here you are integrating the D3 HeatMap component with the pivot matrix and the pivot configurator plugin.
3. Then, you have to add the Controller:
Ext.define('KitchenSink.view.d3.heatmap.PivotController', {
extend: 'Ext.app.ViewController',
alias: 'controller.heatmap-pivot',
changeDock: function(button, checked) {
if (checked) {
this.getView().getConfigurator().setDock(button.text.toLowerCase());
}
},
monthLabelRenderer: function(v) {
return Ext.Date.monthNames[v];
},
onRefreshData: function() {
var me = this,
heatmap = me.lookupReference('heatmap'),
store = heatmap.getMatrix().store;
store.refreshRandomData(100);
},
onBeforeAddConfigField: function(panel, config) {
var dest = config.toContainer;
if (dest.getFieldType() !== 'all' && dest.items.getCount() >= 1) {
// this will force single fields on both axis and aggregate
dest.removeAll();
}
},
onShowFieldSettings: function(panel, config) {
var align = config.container.down('[name=align]');
// hide the alignment field in settings since it's useless
if (align) {
align.hide();
}
},
onTooltip: function(component, tooltip, datum, element, event) {
var d = datum.data,
x = component.getXAxis().getField(),
y = component.getYAxis().getField(),
z = component.getColorAxis().getField();
tooltip.setHtml(
'<div>X: ' + d + '</div>' +
'<div>Y: ' + d[y] + '</div>' +
'<div>Z: ' + d[z] + '</div>' +
'<div>Records: ' + d.records + '</div>'
);
}
});
4. Next, you have to create a new file, called Store. Add this code:
Ext.define('KitchenSink.store.pivot.Sales', {
extend: 'Ext.data.Store',
alias: 'store.sales',
model: 'KitchenSink.model.pivot.Sale',
proxy: {
// load using HTTP
type: 'ajax',
limitParam: null,
url: '/KitchenSink/SalesData',
// the return will be JSON, so lets set up a reader
reader: {
type: 'json'
}
},
autoLoad: true
});
You can view the demo here.
How can I use D3 in Javascript?
That’s it! You have learned to use three different D3 components for visualizing data. You can use the same methods discussed in this post to add amazing data visualizations in your cross-platform web application using Sencha Ext JS.


Latest Content

12 Best Application Development Software Tools for Enterprise Teams in 2026
Enterprise teams in 2026 build applications using a stack of complementary application development software tools…
July 16, 2026

7 Best React Data Grids in 2026: Performance, Features, and Pricing Compared
React data grid selection significantly affects enterprise application development outcomes because grids are often the…
July 16, 2026

Front-End Frameworks for Banks and Financial Institutions: A 2026 Guide
Banks and financial institutions face front-end framework choices that affect application performance, security, regulatory compliance,…
July 15, 2026


