Build a Real-Time Javascript Stock Charts Using Sencha Ext JS
Real-time stock market data tracking is essential for investors and traders. It serves as a tool for making optimal decisions, especially in web application development where real-time updates are crucial. The Marketstack API offers access to over 25,000 stock tickers globally and provides more than 30 years of historical data, making it a reliable source for stock market insights. Moreover, Sencha Ext JS provides tools to create such charts.
In this blog, we will guide you in building a real-time stock charting app using Sencha Cmd and Ext JS development techniques. Sencha Ext JS applications are known for their powerful capabilities, particularly in creating data-rich desktop apps. This JavaScript framework is designed to simplify web application development while providing high-performance UI components to enhance user experience.
We will also utilize the Marketstack API to connect to real-time stock data, offering an efficient solution for both desktop apps and web application development. First, we will explain the importance of building real-time JavaScript charts, which are essential for Ext JS applications. Then, we will discuss why Sencha Ext JS might be the best choice for creating these charts.
Next, we will highlight the key features of the Marketstack API and explain how it can be integrated into Ext JS development. After that, we will outline a step-by-step process for preparing models and developing views, guiding you through fundamental stock data tracking, such as opening, closing, high and low prices, and making use of efficient coding strategies.
Finally, we will explain how to publish and test the app to ensure seamless performance in real-time stock tracking. Let’s get started with building your first Ext JS stock charting app!

Why Do You Need to Build Real-time JavaScript Charts?
Real-time JavaScript charts are crucial for building web applications that deal with up-to-date information. Businesses and analysts rely on live data to make decisions, whether it’s stock market prices or IoT sensor data. Outdated schemes are no longer sufficient.
Real-time data helps users detect emerging patterns or spikes quickly. In financial tools, live stock data allows traders to respond to market changes promptly. Similarly, real-time monitors in healthcare or logistics raise concerns about how effective services would be without delays in resolving issues.
JavaScript, particularly in frameworks like Sencha Touch and Ext JS version, enables building these charts efficiently. It is ideal for this because it runs on web browsers and handles real-time data seamlessly. Libraries like Sencha Ext JS version or D3.js simplify managing the data layer and data streams. APIs or WebSockets facilitate the use of live data streams.
Developers can use tools like Chrome Dev Tools to debug and optimize these applications effectively. These charts are also flexible and optimized for various devices, ensuring efficient usage on both mobile applications and desktops.
For those working with JS versions tailored for mobile and desktop development, Sencha Touch and other libraries provide powerful solutions.

Why Choose Sencha Ext JS for Building the Stock Charts?
Sencha Ext JS is well-suited for stock charts. It provides rich tools, numerous components, and a solid foundation. Here’s why:
1. Comprehensive Charting Capabilities
Sencha Ext JS includes Chart Components, such as line and bar charts. It is one of the best JavaScript libraries. You can configure these to create professional stock charts. These charts are designed for real-time and can be customized for specific feeds.

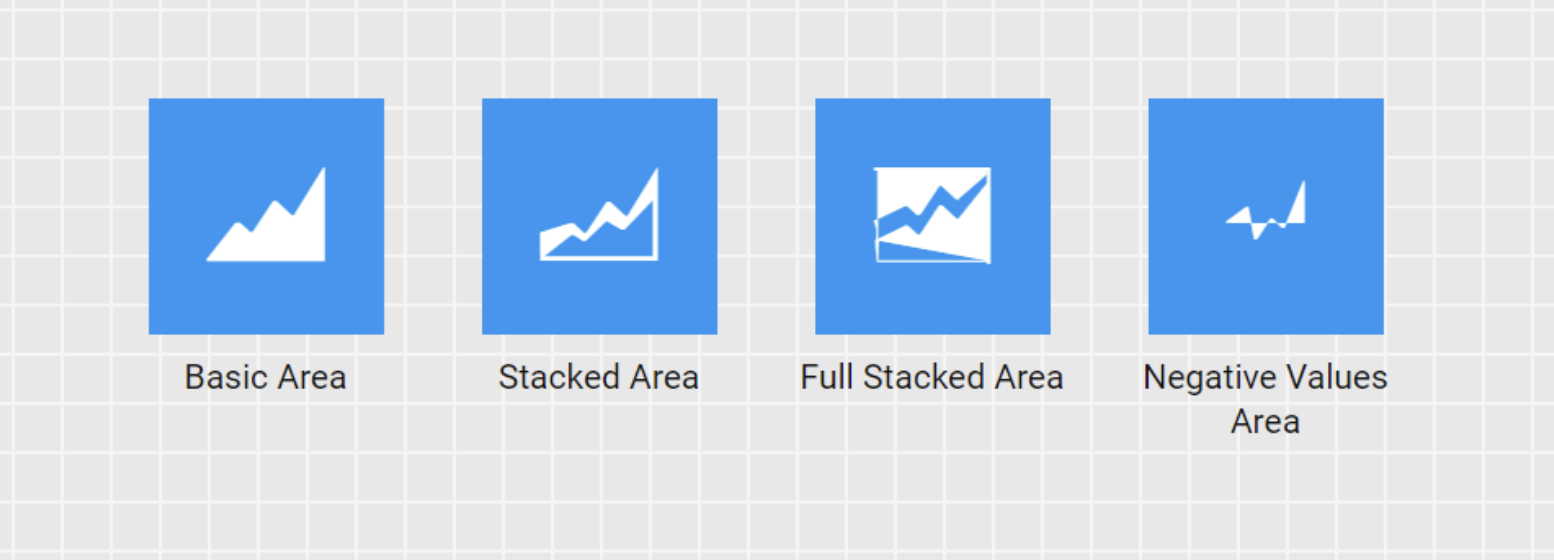
The interesting part here is that you can get detailed chart designs. For example, Sencha provides the following types of area charts:

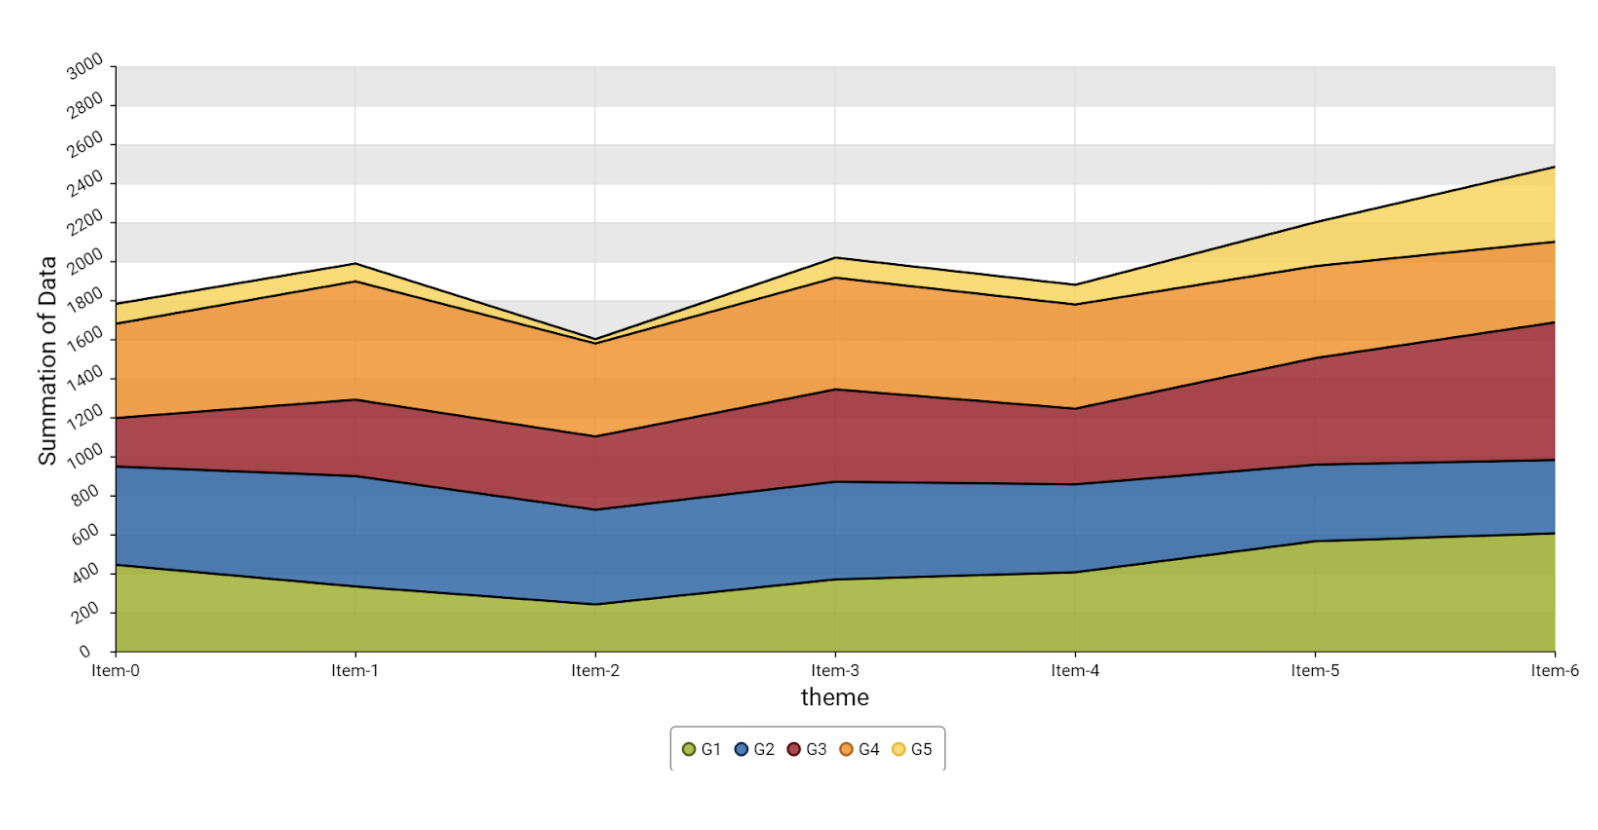
Here is the basic area chart:

Code Example
import '../../charttoolbar/ChartToolbar.js';

import './BasicAreaComponent.html';

import createData from './BasicAreaComponentData.js';


Ext.require([

    'Ext.chart.theme.Midnight',

    'Ext.chart.theme.Green',

    'Ext.chart.theme.Muted',

    'Ext.chart.theme.Purple',

    'Ext.chart.theme.Sky',

    'Ext.chart.series.Area',

    'Ext.chart.axis.Numeric',

    'Ext.chart.axis.Category'

]);


export default class BasicAreaComponent {

    constructor() {

        this.store = Ext.create('Ext.data.Store', {

            fields: ['id', 'g0', 'g1', 'g2', 'g3', 'g4', 'g5', 'g6', 'name'],

        });


        this.store.loadData(createData(25));

        this.theme = 'default';

        this.menuCmpArray = [];

    }


    // onMenuItemReady = (event) => {

    //     if (event.detail.cmp) {

    //         this.menuCmpArray.push(event.detail.cmp);

    //         event.detail.cmp.on('click', this.onThemeChange.bind(this));

    //     }

    // }


    // onRefreshButtonReady = (event) => {

    //     this.refreshButtonCmp = event.detail.cmp;

    //     this.refreshButtonCmp.on('tap', this.onRefreshClick.bind(this));

    // }


    onRefreshTap = () => {

        this.store.loadData(createData(25));

        this.cartesianCmp.setStore(this.store);

    }


    onThemeChange = (event) => {

      console.log('hi')

        this.theme = event.config.text.toLowerCase();

        this.menuCmpArray.forEach((cmp, index) => {

            if (index == parseInt(event.config.itemId)) {

                cmp.setIconCls('x-font-icon md-icon-done');

                return;

            }

            cmp.setIconCls('');

        });

        this.cartesianCmp.setTheme(event.config.text.toLowerCase());

    }


    cartesianReady = (event) => {

        this.cartesianCmp = event.detail.cmp;

        this.cartesianCmp.setStore(this.store);

        this.cartesianCmp.setTheme(this.theme);

    }

}
2. Efficient Data Management
Managing large data sets is challenging in stock charts. Ext JS excels in data binding and data stores for mobile web apps. Dynamic data is efficiently handled through the API. Buffered Data Stores ensure that even large data sets load quickly.
3. Real-Time Data Updates
Stock charts require constant updates. Ext JS provides real-time data effectively. Charts update smoothly without redrawing the entire chart. Data flow is managed through streaming or WebSocket APIs. This ensures that stock prices remain up to date.
4. Cross-Platform Compatibility
Ext JS supports various devices, from desktops to tablets and phones. The charts resize themselves to fit different resolutions. This ensures stock information is accessible on any device.
5. Development Tools
Sencha includes development tools like Sencha Architect. This allows users to create UI screens by dragging and dropping objects. It speeds up chart development. Sencha Themer enables customizing chart styles to meet specific company needs. These tools contribute to faster and more efficient development.
What is Marketstack API?
Marketstack is a user-friendly and free REST API. It allows the streaming of present and past stock market data. Its major advantage is the global historical database available in JSON format. You can also make up to 100 free API requests per month, which is noteworthy.
Over 30,000 customers around the globe use Marketstack.
Major corporations like Accenture, Uber, Amazon, and GARMIN rely on it.
Every hour of every day, Marketstack updates its application. It pushes the most relevant and up-to-date stock data to the client. It has over 170,000 active stock tickers. Marketstack also provides historical stock information for over thirty years. This makes it a great asset for reliable and current stock market information.
Why Should You Use Marketstack API?
- Offers real-time, intraday, and historical stock market data in JSON format, which is very easy to integrate with web applications
- Supports integration with multiple languages and frameworks, including JavaScript, Python, Node, and Go
- Handles traffic spike efficiently
- Offers bank-grade security using the industry-standard 256-bit HTTPS encryption
- Provides easy-to-follow documentation
How to Build a Real-Time Stock Market Web Application with Sencha Ext JS and Marketstack API
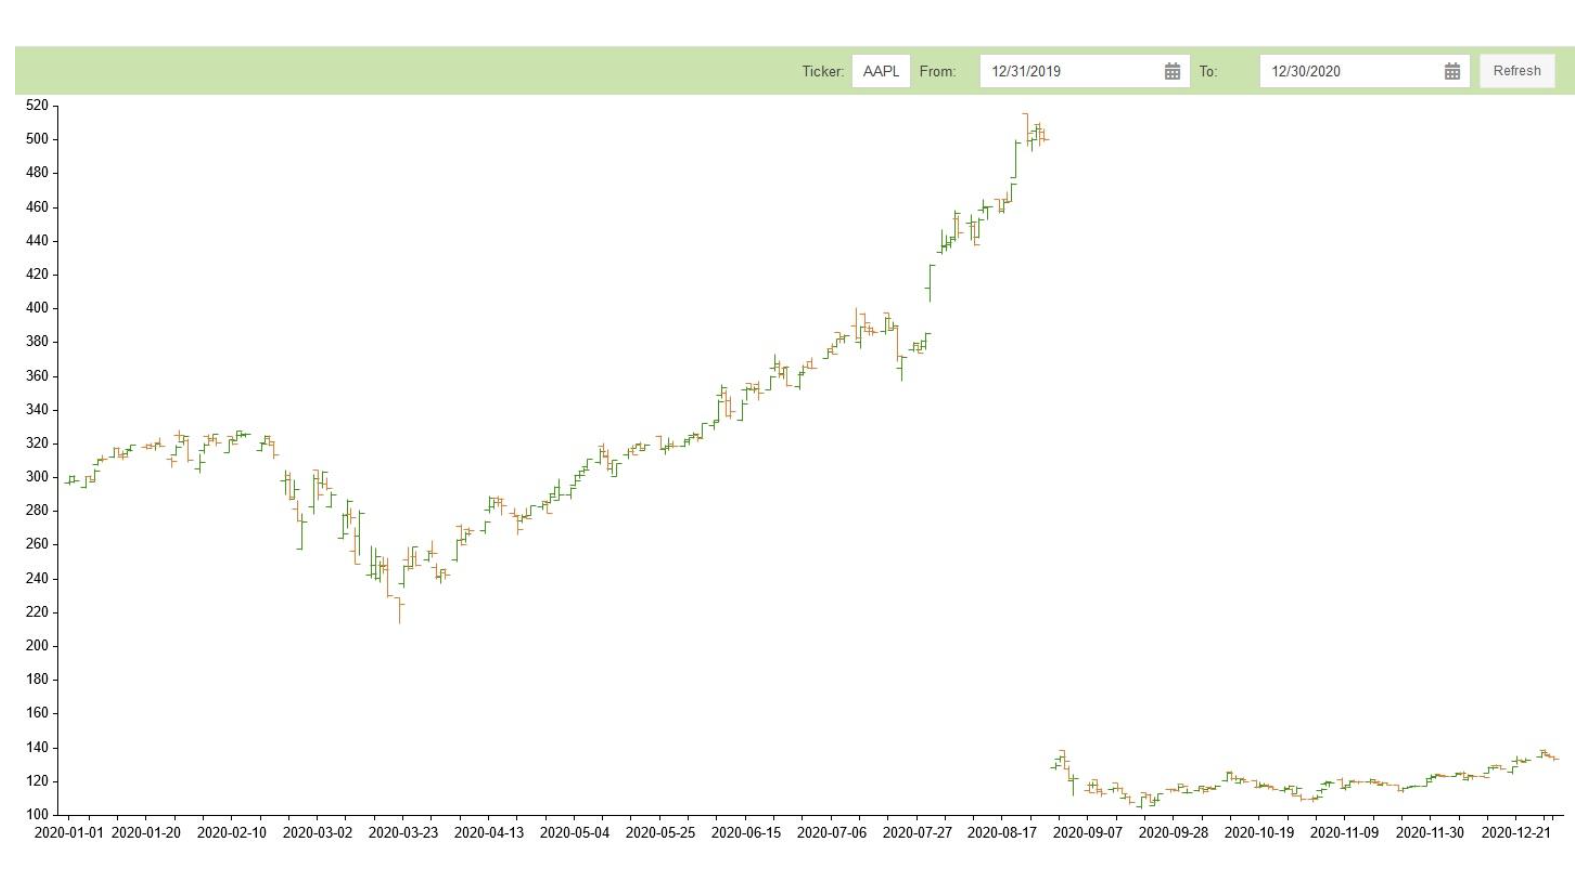
Sencha Ext JS framework is a feature-rich JavaScript framework for building business-grade web applications. By integrating Marketstack API, you can create a real-time Javascript stock charts application easily. Take a look at it:

To create the stock market application shown above, follow these steps:
Create the Model
Go to app > model folder. Create HomeModel.js and add the following code:
Ext.define('Demo.model.HomeModel', {

    extend: 'Ext.data.Model',

    alternateClassName: ['home'],

    requires: [

        'Ext.data.field.Number',

        'Ext.data.proxy.Rest'

    ],

    fields: [

        { type: 'float', name: 'low' },

        { type: 'float', name: 'high' },

        { type: 'int', name: 'date' },

        { type: 'float', name: 'close' },

        { type: 'float', name: 'open' }

    ],

    proxy: { type: 'rest' }

});
Here, different fields such as open, close, date, high, and low are added, and their types are defined.
Create the View
Go to the view folder and create OHLCCharts.js. Add the following code:
Ext.define('Demo.view.OHLCCharts', {

    extend: 'Ext.panel.Panel',

    alias: 'widget.OHLCCharts',

    alternateClassName: ['OHLCCharts'],

    requires: [

        'Demo.view.OHLCChartsViewModel',

        'Demo.view.OHLCChartsViewController',

        'Ext.toolbar.Toolbar',

        'Ext.toolbar.Fill',

        'Ext.form.field.Date',

        'Ext.button.Button',

        'Ext.chart.CartesianChart',

        'Ext.chart.axis.Time',

        'Ext.chart.series.CandleStick',

        'Ext.chart.interactions.PanZoom',

        'Ext.chart.interactions.Crosshair'

    ],

    controller: 'ohlccharts',

    viewModel: { type: 'ohlccharts' },

    dock: 'top',

    height: '100vh',

    padding: 0,

    style: { background: '#ffffff' },

    width: '100wh',

    layout: 'fit',

    bodyPadding: 0,

    frameHeader: false,

    manageHeight: false,

    dockedItems: [

        {

            xtype: 'toolbar',

            border: 2,

            dock: 'top',

            style: { background: '#c6e4aa' },

            layout: { type: 'hbox', padding: '0 10 0 0' },

            items: [

                { xtype: 'tbfill' },

                { xtype: 'textfield', id: 'tickerInput', width: 100, fieldLabel: 'Ticker', labelWidth: 40, value: 'AAPL' },

                { xtype: 'datefield', id: 'fromDatePicker', width: 250, fieldLabel: 'From', labelWidth: 50, value: '01/01/2020' },

                { xtype: 'datefield', id: 'toDatePicker', width: 250, fieldLabel: 'To', labelWidth: 50, value: '12/31/2020' },

                { xtype: 'button', id: 'refreshBtn', text: 'Refresh', listeners: { click: 'onRefreshBtnClick' } }

            ]

        },

        {

            xtype: 'cartesian',

            height: '85vh',

            id: 'mycandlestickchart',

            store: 'BtcRateDataJsonPStore',

            axes: [

                { type: 'time', fields: ['date'], position: 'bottom' },

                { type: 'numeric', fields: ['low', 'high', 'close', 'open'], position: 'left' }

            ],

            series: [

                {

                    type: 'candlestick',

                    xField: 'date',

                    closeField: 'close',

                    highField: 'high',

                    lowField: 'low',

                    openField: 'open'

                }

            ],

            interactions: [

                { type: 'panzoom', zoomOnPan: true },

                { type: 'crosshair' }

            ]

        }

    ],

    listeners: { afterrender: 'onPanelAfterRender', render: 'onPanelRender' }

});
Create the View Controller
Create OHLCChartsViewController.js inside the view folder:
Ext.define('Demo.view.OHLCChartsViewController', {

    extend: 'Ext.app.ViewController',

    alias: 'controller.ohlccharts',

    updateUI: function(startDate, endDate, tickerType) {

        if (!startDate || !endDate) {

            startDate = '2020-01-01';

            endDate = '2020-12-31';

        }

        if (this.isVaildPeriod(startDate, endDate)) {

            var mycandlestickchart = Ext.ComponentQuery.query('#mycandlestickchart')[0];

            var store = mycandlestickchart.getStore();

            var marketstackStore = Ext.getStore("marketstackStore");

            marketstackStore.proxy.extraParams.date_from = startDate;

            marketstackStore.proxy.extraParams.date_to = endDate;

            marketstackStore.proxy.extraParams.symbols = tickerType;

            marketstackStore.load({

                scope: this,

                callback: function(records) {

                    store.setData(records);

                }

            });

        }

    },

    isVaildPeriod: function(startDate, endDate) {

        startDate = new Date(startDate);

        endDate = new Date(endDate);

        var days = Math.round((endDate - startDate) / (24  3600  1000));

        if (days > 1000 || days === 0) {

            Ext.Msg.alert('Alert', 'You can only view data for one year (365 days).');

            return false;

        } else {

            return true;

        }

    },

    initMarketStackStore: function() {

        Ext.create('Ext.data.Store', {

            id: 'marketstackStore',

            model: 'Demo.model.HomeModel',

            proxy: {

                type: 'rest',

                url: 'https://api.marketstack.com/v1/eod',

                extraParams: {

                    access_key: 'YOUR_ACCESS_KEY',

                    symbols: 'AAPL',

                    date_from: '2021-03-31',

                    date_to: '2021-04-10'

                }

            }

        });

    },

    onRefreshBtnClick: function() {

        var fromDate = Ext.ComponentQuery.query('#fromDatePicker')[0].value;

        var toDate = Ext.ComponentQuery.query('#toDatePicker')[0].value;

        var tickerType = Ext.ComponentQuery.query('#tickerInput')[0].value;

        this.updateUI(fromDate, toDate, tickerType);

    },

    onPanelAfterRender: function() {

        this.updateUI("2020-01-01", "2020-12-31", "AAPL");

    }

});
Create the View Model
Inside the view folder, create OHLCChartsViewModel.js:
Ext.define('Demo.view.OHLCChartsViewModel', {

    extend: 'Ext.app.ViewModel',

    alias: 'viewmodel.ohlccharts'

});
Create the Controller
Go to app > controller folder. Create MyController.js:
Ext.define('Demo.controller.MyController', {

    extend: 'Ext.app.Controller'

});
Get the Marketstack API Key
Sign up at Marketstack and get the access key. You’ll need this key to authenticate API requests.
Create the Store
Go to app > store folder and create BtcRateDataJsonPStore.js:
Ext.define('Demo.store.BtcRateDataJsonPStore', {

    extend: 'Ext.data.Store',

    alias: 'store.BtcRateDataStore',

    model: 'Demo.model.HomeModel',

    proxy: {

        type: 'jsonp',

        url: 'https://api.marketstack.com/v1/eod',

        extraParams: {

            access_key: 'YOUR_ACCESS_KEY',

            symbols: 'AAPL',

            date_from: '2021-03-31',

            date_to: '2021-04-10',

            limit: 1000

        },

        reader: { type: 'json', rootProperty: 'data' }

    }

});
This completes the process of setting up your real-time stock market application using Sencha Ext JS and Marketstack API.
Integrating the Marketstack API with the ExtJS App
Keep in mind that you are inserting the access key of Marketstack API, which you obtained in Step 6, by using these codes (replace ‘YOUR ACCESS KEY’ with your actual API key):
extraParams: { access_key: 'YOUR_ACCESS_KEY',
Also, take a look at this line:
url: 'https://api.marketstack.com/v1/eod',
That’s it! You have built a real-time stock market web application with Sencha Ext JS and Marketstack API, which looks like this:
Source Code:
You can find the project files on GitHub.
How to launch the project on your PC?
- To run the project, you will need Sencha Architect.
- You can download it for free from here.
- Once you are done with the installation, open the project on Sencha Architect.
- Then preview and build it. The stock market app will show up on your favorite web browser.
Conclusion
In this tutorial, we learned how to develop an application for online stock market monitoring. We used the Popular JavaScript Framework Sencha Ext JS and the Marketstack API.
Afterward, we got the Marketstack API. This highlighted its features, documentation, and global coverage. These basic components play crucial roles in web development. The creation of models, views, and controllers is essential and rich in features. These elements help the end user easily understand the collected stock market information.
It is now easy to follow stock trends with Marketstack’s real-time data integration. This tutorial provides the tools to create a fully customizable stock charting application.
Finally, we demonstrated how to deploy the application using Sencha Architect. This enables real-time decision-making.
FAQs
What Are the Benefits of Learning Sencha Ext JS?
Learning Sencha Ext JS helps build robust, cross-platform web and mobile applications efficiently.
Why Are People Still Using Ember and Ext JS for New Projects?
People use Ember and Ext JS for their mature ecosystems, stability, and extensive component libraries.
Is Ext JS Still a Good JavaScript Framework Choice for Greenfield Projects?
Yes, Ext JS is ideal for complex, enterprise-level applications due to its rich UI components.
What Are the Advantages and Disadvantages of Ext JS?
Ext JS offers a rich component library and scalability but can be costly and heavy for small apps.
Sign Up for free at Ext JS and create beautiful stock data package charts today!

React is perhaps the most widely used web app-building framework right now. Many developers also…

React’s everywhere. If you’ve built a web app lately, chances are you’ve already used it.…

Join 5,000+ developers at the most anticipated virtual JavaScript event of the year — August…


