



 Ask Sencha AI
How to Create a Responsive JavaScript Admin Dashboard Easily with Ext JS
May 20, 2021
5708 Views
Get a summary of this article:
A well-built admin dashboard can significantly increase the productivity of your business. With Sencha Ext JS, you can create responsive admin dashboards easily, allowing your company to discover valuable insights into your data at a glance. Sencha Ext JS simplifies dashboard web app development, letting you create powerful, responsive dashboards without complex coding.
With Sencha Ext JS, you can also build an interactive mobile dashboard Ext JS, giving users real-time insights on any device. This ensures that your team stays connected to critical business data whether they’re in the office or on the go.
The benefits are clear — with a better understanding of your data, you can make more timely and informed business decisions.
In this post, you will find all the details you need to get started on your admin dashboard.
What is Sencha Ext JS?
Sencha Ext JS is a very powerful JavaScript web framework. It excels in allowing you to quickly create feature-rich web applications. To help you do this, it includes over 140 UI components, including the D3 adapter, grids, and panels. More importantly, Sencha Ext JS supports cross-platform functionality so you can use it to build web apps for any modern device, like desktop PCs, laptops, and smartphones.
How to Build a Responsive Admin Dashboard with Sencha
Because it supports the MVC architecture, creating admin dashboards is pretty easy with Sencha Ext JS. Let’s explore the possibilities, starting with this example:
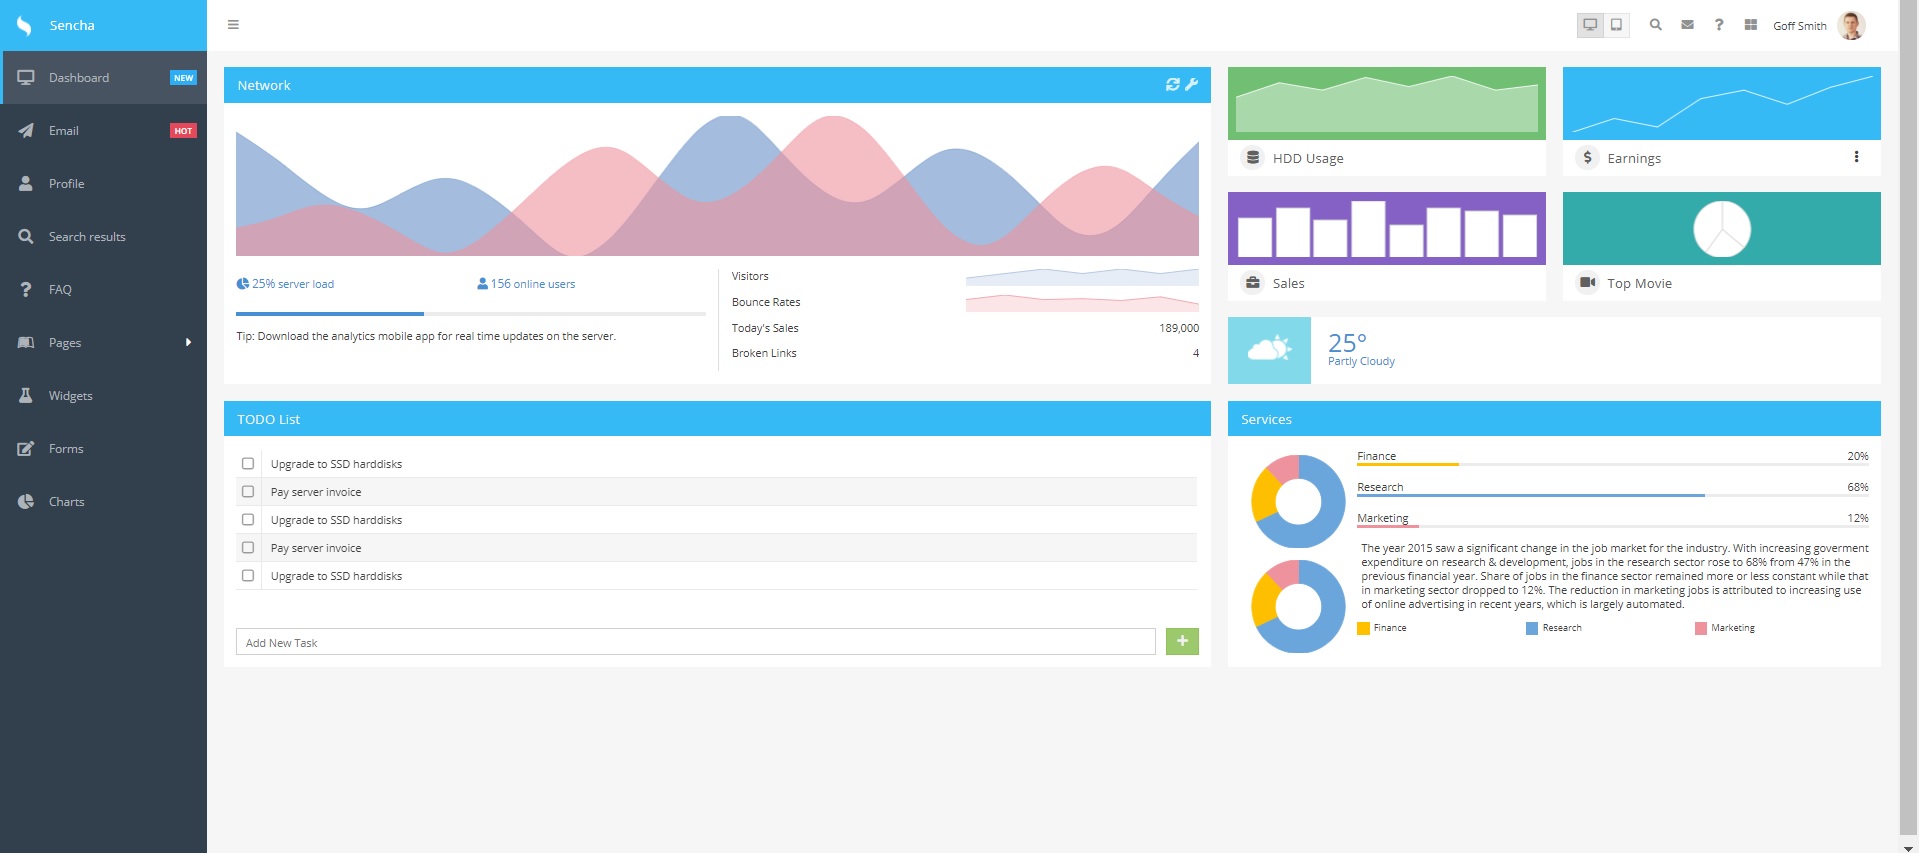
To build the dashboard shown above, you have to follow these steps:
Create the Model
1. Create a new directory, called the model. Go inside the folder. Then create the email directory. Inside the new folder, create an Email.js file and add these codes:
Ext.define('Admin.model.email.Email', {
extend: 'Admin.model.Base',
fields: [
{
type: 'int',
name: 'id'
},
{
name: 'read'
},
{
type: 'string',
name: 'title'
},
{
name: 'user_id'
},
{
type: 'string',
name: 'contents'
},
{
type: 'string',
name: 'from'
},
{
name: 'has_attachments'
},
{
name: 'attachments'
},
{
name: 'received_on',
type: 'date'
},
{
name: 'favorite'
}
]
});
Here, you are adding various fields, including id, title, and content.
2. Next, create a Friend.js file and add this code:
Ext.define('Admin.model.email.Friend', {
extend: 'Admin.model.Base',
fields: [
{
type: 'int',
name: 'id'
},
{
type: 'string',
name: 'name'
},
{
type: 'string',
name: 'thumbnail'
},
{
type: 'boolean',
name: 'online'
}
]
});
3. When you are done, go back to the model folder and create the faq directory. Inside the new folder, create your Category.js file and add the following:
Ext.define('Admin.model.faq.Category', {
extend: 'Admin.model.Base',
fields: [
{
type: 'string',
name: 'name'
}
],
hasMany: {
name: 'questions',
model: 'faq.Question'
}
});
4. Create Question.js file and add these codes:
Ext.define('Admin.model.faq.Question', {
extend: 'Admin.model.Base',
fields: [
{
type: 'string',
name: 'name'
}
]
});
5. After that, go back to the model folder. Then create the search directory. Inside the new folder, create your Attachment.js file and add this code:
Ext.define('Admin.model.search.Attachment', {
extend: 'Admin.model.Base',
fields: [
{
type: 'int',
name: 'id'
},
{
type: 'string',
name: 'url'
},
{
type: 'string',
name: 'title'
}
]
});
6. Ok, now create your Result.js file and add this code:
Ext.define('Admin.model.search.Result', {
extend: 'Admin.model.Base',
fields: [
{
type: 'int',
name: 'id'
},
{
type: 'string',
name: 'title'
},
{
type: 'string',
name: 'thumbnail'
},
{
type: 'string',
name: 'url'
},
{
type: 'string',
name: 'content'
}
],
hasMany: {
name: 'attachments',
model: 'search.Attachment'
}
});
7. We are almost there. Create your User.js file and add these lines:
Ext.define('Admin.model.search.User', {
extend: 'Admin.model.Base',
fields: [
{
type: 'int',
name: 'identifier'
},
{
type: 'string',
name: 'fullname'
},
{
type: 'string',
name: 'email'
},
{
name: 'subscription'
},
{
type: 'date',
name: 'joinDate'
},
{
type: 'boolean',
name: 'isActive'
},
{
name: 'profile_pic'
}
]
});
8. When you have done that, go back to the model folder. Create a Base.js file and insert these lines:
Ext.define('Admin.model.Base', {
extend: 'Ext.data.Model',
schema: {
namespace: 'Admin.model'
}
});
Here, you are defining the schema.
9. Now it’s time to creating the model for chat messages. Create the ChatMessages.js file. Then add this code:
Ext.define('Admin.model.ChatMessages', {
extend: 'Admin.model.Base',
fields: [
{
type: 'string',
name: 'message'
},
{
type: 'string',
defaultValue: 'user',
name: 'sender'
}
]
});
10. Now create the DataXY.js file and insert these lines:
Ext.define('Admin.model.DataXY', {
extend: 'Admin.model.Base',
fields: [
{
name: 'xvalue'
},
{
name: 'yvalue'
}
]
});
11. Next you have to create the model for the friend list. Create FriendList.js file. Then insert these lines:
Ext.define('Admin.model.FriendsList', {
extend: 'Admin.model.Base',
fields: [
{
name: 'friendsName'
},
{
name: 'connectionStatus'
}
]
});
12. Create a MultiDataXY.js file. Add these lines:
Ext.define('Admin.model.MultiDataXY', {
extend: 'Admin.model.Base',
fields: [
{
name: 'xvalue'
},
{
name: 'y1value'
},
{
name: 'y2value'
},
{
name: 'y3value'
},
{
name: 'y4value'
}
]
});
13. Now you have to create the settings for your panel. Create the PanelSetting.js file. Insert these lines of code:
Ext.define('Admin.model.PanelSetting', {
extend: 'Admin.model.Base',
fields: [
{
name: 'title'
},
{
name: 'subTitle'
},
{
name: 'toggleStatus'
}
]
});
14. Next, you have to create a model for personal information. Create PersonalInfo.js file. Add this code:
Ext.define('Admin.model.PersonalInfo', {
extend: 'Admin.model.Base',
fields: [
{
name: 'name'
},
{
name: 'status'
},
{
name: 'icon'
}
]
});
15.Create the model for a subscription. Create Susbcription.js file and add these lines:
Ext.define('Admin.model.Subscription', {
extend: 'Admin.model.Base',
fields: [
{
type: 'int',
name: 'id'
},
{
type: 'string',
name: 'name'
},
{
type: 'string',
name: 'subscription'
}
]
});
16. Almost done. Create YearwiseData.js file. Then insert the following:
Ext.define('Admin.model.YearwiseData', {
extend: 'Admin.model.Base',
fields: [
{
name: 'year'
},
{
name: 'data'
}
]
});
Create the View
1. Now, you have to create views for the charts on the dashboard. Go into the view folder. Create a new folder, called chart. Go into the chart folder and create your Bounce.js file. Then add this:
Ext.define('Admin.view.chart.Bounces', {
extend: 'Ext.chart.CartesianChart',
xtype: 'chartbounces',
requires: [
'Ext.chart.axis.Category',
'Ext.chart.axis.Numeric',
'Ext.chart.series.Area',
'Ext.chart.interactions.PanZoom'
],
animation : !Ext.isIE9m && Ext.os.is.Desktop,
height: 22,
background: 'rgba(255, 255, 255, 1)',
colors: [
'rgba(250,222,225, 0.8)'
],
insetPadding: {
top: 0,
left: 0,
right: 0,
bottom: 0
},
axes: [
{
type: 'category',
fields: [
'xvalue'
],
hidden: true,
position: 'bottom'
},
{
type: 'numeric',
fields: [
'y2value'
],
grid: {
odd: {
fill: '#e8e8e8'
}
},
hidden: true,
position: 'left'
}
],
series: [
{
type: 'area',
xField: 'xvalue',
yField: [
'y2value'
]
}
],
interactions: [
{
type: 'panzoom'
}
]
});
2. Create a Network.js file. Then add these lines:
Ext.define('Admin.view.chart.Network', {
extend: 'Ext.chart.CartesianChart',
xtype: 'chartnetwork',
requires: [
'Ext.chart.axis.Category',
'Ext.chart.axis.Numeric',
'Ext.chart.series.Line',
'Ext.chart.interactions.PanZoom'
],
animation : !Ext.isIE9m && Ext.os.is.Desktop,
insetPadding: 0,
axes: [
{
type: 'category',
fields: [
'xvalue'
],
hidden: true,
position: 'bottom'
},
{
type: 'numeric',
fields: [
'y1value',
'y2value'
],
grid: {
odd: {
fill: '#e8e8e8'
}
},
hidden: true,
position: 'left'
}
],
series: [
{
type: 'line',
colors: [
'rgba(103, 144, 199, 0.6)'
],
useDarkerStrokeColor: false,
xField: 'xvalue',
yField: 'y1value',
fill: true,
smooth: true
},
{
type: 'line',
colors: [
'rgba(238, 146, 156, 0.6)'
],
useDarkerStrokeColor: false,
xField: 'xvalue',
yField: 'y2value',
fill: true,
smooth: true
}
],
interactions: [
{
type: 'panzoom'
}
]
});
3. Create Visitors.js file. Insert these codes:
Ext.define('Admin.view.chart.Visitors', {
extend: 'Ext.chart.CartesianChart',
xtype: 'chartvisitors',
requires: [
'Ext.chart.axis.Category',
'Ext.chart.axis.Numeric',
'Ext.chart.series.Area',
'Ext.chart.interactions.PanZoom'
],
animation : !Ext.isIE9m && Ext.os.is.Desktop,
height: 22,
background: 'rgba(255, 255, 255, 1)',
colors: [
'rgba(225,233,244, 0.8)'
],
insetPadding: {
top: 0,
left: 0,
right: 0,
bottom: 0
},
axes: [
{
type: 'category',
fields: [
'xvalue'
],
hidden: true,
position: 'bottom'
},
{
type: 'numeric',
fields: [
'y1value'
],
grid: {
odd: {
fill: '#e8e8e8'
}
},
hidden: true,
position: 'left'
}
],
series: [
{
type: 'area',
xField: 'xvalue',
yField: [
'y1value'
]
}
],
interactions: [
{
type: 'panzoom'
}
]
});
4. Go to the view folder. Create a new folder, called charts. Go inside this directory and create your Area.js file. Insert these lines:
Ext.define('Admin.view.charts.Area', {
extend: 'Admin.view.charts.ChartBase',
xtype: 'chartsareapanel',
requires: [
'Ext.chart.CartesianChart',
'Ext.chart.axis.Category',
'Ext.chart.axis.Numeric',
'Ext.chart.series.Line',
'Ext.chart.interactions.PanZoom'
],
title: 'Area Chart',
iconCls: 'x-fa fa-chart-area',
items: [{
xtype: 'cartesian',
colors: [
'#115fa6',
'#94ae0a'
],
bind: '{areaData}',
series: [
{
type: 'line',
colors: [
'rgba(103, 144, 199, 0.6)'
],
xField: 'xvalue',
yField: [
'y1value'
],
fill: true,
smooth: true
},
{
type: 'line',
colors: [
'rgba(238, 146, 156, 0.6)'
],
xField: 'xvalue',
yField: [
'y2value'
],
fill: true,
smooth: true
}
],
platformConfig: {
phone: {
// On a phone the whole view becomes a vertical strip of charts,
// which makes it impossible to scroll the view if touch action
// started on a chart. So we use a custom touchAction config.
touchAction: {
panX: true,
panY: true
}
},
'!phone': {
interactions: {
type: 'panzoom',
zoomOnPanGesture: true
}
}
},
axes: [{
type: 'category',
fields: [
'xvalue'
],
hidden: true,
position: 'bottom'
},{
type: 'numeric',
fields: [
'y1value',
'y2value',
'y3value'
],
grid: {
odd: {
fill: '#e8e8e8'
}
},
hidden: true,
position: 'left'
}]
}]
});
5. Next, you have to create the view for the bar chart. Create a Bar.js file and insert this:
Ext.define('Admin.view.charts.Bar', {
extend: 'Admin.view.charts.ChartBase',
xtype: 'chartsbarpanel',
requires: [
'Ext.chart.CartesianChart',
'Ext.chart.axis.Category',
'Ext.chart.axis.Numeric',
'Ext.chart.interactions.PanZoom',
'Ext.chart.series.Bar'
],
title: 'Bar Chart',
iconCls: 'x-fa fa-chart-bar',
items: [{
xtype: 'cartesian',
colors: [
'#6aa5db'
],
bind: '{barData}',
axes: [{
type: 'category',
fields: [
'xvalue'
],
hidden: true,
position: 'bottom'
},{
type: 'numeric',
fields: [
'yvalue'
],
grid: {
odd: {
fill: '#e8e8e8'
}
},
hidden: true,
position: 'left'
}],
series: [{
type: 'bar',
xField: 'xvalue',
yField: [
'yvalue'
]
}],
platformConfig: {
phone: {
// On a phone the whole view becomes a vertical strip of charts,
// which makes it impossible to scroll the view if touch action
// started on a chart. So we use a custom touchAction config.
touchAction: {
panX: true,
panY: true
}
},
'!phone': {
interactions: {
type: 'panzoom',
zoomOnPanGesture: true
}
}
}
}]
});
6. When yo8u have done that, create a ChartBase.js file and add this code:
Ext.define('Admin.view.charts.ChartBase', {
extend: 'Ext.Panel',
height: 300,
ui: 'light',
layout: 'fit',
platformConfig: {
classic: {
cls: 'quick-graph-panel shadow',
headerPosition: 'bottom'
},
modern: {
cls: 'quick-graph-panel',
shadow: true,
header: {
docked: 'bottom'
}
}
},
defaults: {
width: '100%'
}
});
7. It is time to create the view for the Gauge graph. Create a Gauge.js file and add these lines:
Ext.define('Admin.view.charts.Gauge', {
extend: 'Admin.view.charts.ChartBase',
xtype: 'chartsgaugepanel',
requires: [
'Ext.chart.PolarChart',
'Ext.chart.series.Gauge'
],
title: 'Gauge Chart',
iconCls: 'x-fa fa-wifi',
items: [{
xtype: 'polar',
colors: [
'#6aa5db',
'#aed581'
],
bind: '{gaugeData}',
series: [{
type: 'gauge',
angleField: 'position',
needleLength: 100
}],
platformConfig: {
phone: {
// On a phone the whole view becomes a vertical strip of charts,
// which makes it impossible to scroll the view if touch action
// started on a chart. So we use a custom touchAction config.
touchAction: {
panX: true,
panY: true
}
}
}
}]
});
8. Next, you have to create the view for the Line Chart. Create your Line.js file and add these lines:
Ext.define('Admin.view.charts.Line', {
extend: 'Admin.view.charts.ChartBase',
xtype: 'chartslinepanel',
requires: [
'Ext.chart.CartesianChart',
'Ext.chart.axis.Category',
'Ext.chart.axis.Numeric',
'Ext.chart.interactions.PanZoom',
'Ext.chart.series.Line'
],
title: 'Line Chart',
iconCls: 'x-fa fa-line-chart',
items: [{
xtype: 'cartesian',
colors: [
'#6aa5db',
'#94ae0a'
],
bind: '{lineData}',
axes: [{
type: 'category',
fields: [
'xvalue'
],
hidden: true,
position: 'bottom'
},{
type: 'numeric',
fields: [
'yvalue',
'y1value',
'y2value',
'y3value',
'y4value',
'y5value'
],
hidden: true,
position: 'left'
}],
series: [{
type: 'line',
xField: 'xvalue',
yField: [
'yvalue'
]
},{
type: 'line',
xField: 'xvalue',
yField: [
'y1value'
]
}],
platformConfig: {
phone: {
// On a phone the whole view becomes a vertical strip of charts,
// which makes it impossible to scroll the view if touch action
// started on a chart. So we use a custom touchAction config.
touchAction: {
panX: true,
panY: true
}
},
'!phone': {
interactions: {
type: 'panzoom',
zoomOnPanGesture: true
}
}
}
}]
});
9. To create the view for the Pie Chart, create your Pie.js file and insert this code:
Ext.define('Admin.view.charts.Pie', {
extend: 'Admin.view.charts.ChartBase',
xtype: 'chartspiepanel',
requires: [
'Ext.chart.PolarChart',
'Ext.chart.interactions.Rotate',
'Ext.chart.series.Pie',
'Ext.chart.series.sprite.PieSlice'
],
title: '2D Pie Chart',
iconCls: 'x-fa fa-chart-pie',
items: [{
xtype: 'polar',
colors: [
'#aed581',
'#6aa5db',
'#ee929c'
],
bind: '{pieData}',
series: [{
type: 'pie',
label: {
field: 'xvalue',
display: 'rotate',
contrast: true,
font: '12px Open Sans',
color: '#888'
},
xField: 'yvalue'
}],
platformConfig: {
'!phone': {
interactions: 'rotate'
}
}
}]
});
10. It is time to create the view for the 3D Pie Chart. To do this, create a Pie3D.js file. Add these lines:
Ext.define('Admin.view.charts.Pie3D', {
extend: 'Admin.view.charts.ChartBase',
xtype: 'chartspie3dpanel',
requires: [
'Ext.chart.PolarChart',
'Ext.chart.interactions.Rotate',
'Ext.chart.series.Pie3D'
],
title: '3D Pie Chart',
iconCls: 'x-fa fa-chart-pie',
items: [{
xtype: 'polar',
colors: [
'#aed581',
'#6aa5db',
'#ee929c'
],
platformConfig: {
phone: {
// On a phone the whole view becomes a vertical strip of charts,
// which makes it impossible to scroll the view if touch action
// started on a chart. So we use a custom touchAction config.
touchAction: {
panX: true,
panY: true
}
},
'!phone': {
interactions: 'rotate'
}
},
bind: '{pieData}',
series: [{
type: 'pie3d',
angleField: 'yvalue',
donut: 30
}]
}]
});
11. Now, you have to create the view for the Polar Chart. Create your Polar.js file and add these lines:
Ext.define('Admin.view.charts.Polar', {
extend: 'Admin.view.charts.ChartBase',
xtype: 'chartspolarpanel',
requires: [
'Ext.chart.PolarChart',
'Ext.chart.axis.Category',
'Ext.chart.axis.Numeric',
'Ext.chart.interactions.Rotate',
'Ext.chart.series.Radar'
],
title: 'Radial Chart',
iconCls: 'x-fa fa-dot-circle',
items: [{
xtype: 'polar',
colors: ['#6aa5db'],
bind: '{radialData}',
axes: [{
type: 'numeric',
fields: [
'yvalue'
],
grid: true,
position: 'radial'
},{
type: 'category',
fields: [
'xvalue'
],
grid: true,
position: 'angular'
}],
series: [{
type: 'radar',
xField: 'xvalue',
yField: 'yvalue'
}],
platformConfig: {
phone: {
// On a phone the whole view becomes a vertical strip of charts,
// which makes it impossible to scroll the view if touch action
// started on a chart. So we use a custom touchAction config.
touchAction: {
panX: true,
panY: true
}
},
'!phone': {
interactions: 'rotate'
}
}
}]
});
12. Next is the view for the Stacked Bar Chart. Create your Stacked.js file and add these lines:
Ext.define('Admin.view.charts.Stacked', {
extend: 'Admin.view.charts.ChartBase',
xtype: 'chartsstackedpanel',
requires: [
'Ext.chart.CartesianChart',
'Ext.chart.axis.Category',
'Ext.chart.axis.Numeric',
'Ext.chart.series.Bar',
'Ext.chart.interactions.PanZoom'
],
title: 'Stacked Bar Chart',
iconCls: 'x-fa fa-chart-bar',
items: [{
xtype: 'cartesian',
colors: [
'#6aa5db',
'#ee929c'
],
bind: '{stackedData}',
axes: [{
type: 'category',
fields: [
'xvalue'
],
hidden: true,
position: 'bottom'
},{
type: 'numeric',
fields: [
'y1value',
'y2value',
'y3value'
],
grid: {
odd: {
fill: '#e8e8e8'
}
},
hidden: true,
position: 'left'
}],
series: [{
type: 'bar',
xField: 'xvalue',
yField: [
'y2value',
'y3value'
]
}],
platformConfig: {
phone: {
// On a phone the whole view becomes a vertical strip of charts,
// which makes it impossible to scroll the view if touch action
// started on a chart. So we use a custom touchAction config.
touchAction: {
panX: true,
panY: true
}
},
'!phone': {
interactions: {
type: 'panzoom',
zoomOnPanGesture: true
}
}
}
}]
});
13. Finally, create your ChartsModel.js file and insert these lines of code:
Ext.define('Admin.view.charts.ChartsModel', {
extend: 'Ext.app.ViewModel',
alias: 'viewmodel.charts',
stores: {
barData: {
model: 'Admin.model.DataXY',
autoLoad: true,
proxy: {
type: 'api',
url: '~api/marketshare/oneyear'
}
},
stackedData: {
model: 'Admin.model.MultiDataXY',
autoLoad: true,
proxy: {
type: 'api',
url: '~api/marketshare/multiyear'
}
},
gaugeData: {
data: [
{
position: 40
}
],
fields: [
{
name: 'position'
}
]
},
radialData: {
model: 'Admin.model.DataXY',
autoLoad: true,
proxy: {
type: 'api',
url: '~api/radial'
}
},
lineData: {
model: 'Admin.model.DataXY',
autoLoad: true,
proxy: {
type: 'api',
url: '~api/marketshare/oneentity'
}
},
pieData: {
model: 'Admin.model.DataXY',
autoLoad: true,
proxy: {
type: 'api',
url: '~api/pie'
}
},
areaData: {
model: 'Admin.model.MultiDataXY',
autoLoad: true,
proxy: {
type: 'api',
url: '~api/dashboard/full'
}
}
}
});
Create the Controller
To wrap the whole thing up we need to create the controller.
1. Go inside your view folder and create a new folder, called dashboard. Inside this directory, create your DashboardController.js file. Then add these lines:
Ext.define('Admin.view.dashboard.DashboardController', {
extend: 'Ext.app.ViewController',
alias: 'controller.dashboard',
requires: [
'Ext.util.TaskRunner'
],
onRefreshToggle: function(tool, e, owner) {
var store, runner;
if (tool.toggleValue) {
this.clearChartUpdates();
} else {
store = this.getStore('networkData');
if (store.getCount()) {
runner = this.chartTaskRunner;
if (!runner) {
this.chartTaskRunner = runner = new Ext.util.TaskRunner();
}
runner.start({
interval: 200,
run: function () {
// Move the first record to the end
var rec = store.first();
store.remove(rec);
store.add(rec);
}
});
}
}
// change the toggle value
tool.toggleValue = !tool.toggleValue;
},
clearChartUpdates : function() {
this.chartTaskRunner = Ext.destroy(this.chartTaskRunner);
},
destroy: function () {
this.clearChartUpdates();
this.callParent();
},
onHideView: function () {
this.clearChartUpdates();
}
});
2. Create the DashboardModel.js file and insert these lines:
Ext.define('Admin.view.dashboard.DashboardModel', {
extend: 'Ext.app.ViewModel',
alias: 'viewmodel.dashboard',
requires: [
'Ext.data.Store',
'Ext.data.field.Integer',
'Ext.data.field.String',
'Ext.data.field.Boolean'
],
stores: {
hddusage: {
autoLoad: true,
model: 'Admin.model.DataXY',
proxy: {
type: 'api',
url: '~api/qg/area'
}
},
quarterlyGrowth: {
autoLoad: true,
model: 'Admin.model.DataXY',
proxy: {
type: 'api',
url: '~api/qg/bar'
}
},
earnings: {
autoLoad: true,
model: 'Admin.model.DataXY',
proxy: {
type: 'api',
url: '~api/qg/line'
}
},
servicePerformance: {
autoLoad: true,
model: 'Admin.model.DataXY',
proxy: {
type: 'api',
url: '~api/qg/pie'
}
},
topMovies: {
autoLoad: true,
model: 'Admin.model.DataXY',
proxy: {
type: 'api',
url: '~api/dashboard/movies'
}
},
networkData: {
autoLoad: true,
model: 'Admin.model.MultiDataXY',
proxy: {
type: 'api',
url: '~api/dashboard/full'
}
},
visitors: {
autoLoad: true,
model: 'Admin.model.MultiDataXY',
proxy: {
type: 'api',
url: '~api/dashboard/visitor'
}
},
bounces: {
autoLoad: true,
model: 'Admin.model.MultiDataXY',
proxy: {
type: 'api',
url: '~api/dashboard/counce'
}
},
subscriptions: {
autoLoad: true,
model: 'Admin.model.Subscription',
proxy: {
type: 'api',
url: '~api/subscriptions'
}
},
todos: {
autoLoad: true,
fields: [
{
type: 'int',
name: 'id'
},
{
type: 'string',
name: 'task'
},
{
type: 'boolean',
name: 'done'
}
],
proxy: {
type: 'api',
url: '~api/dashboard/tasks'
}
}
}
});
Source Code:
If you need help, you can find the source code by downloading the GPL version of the Sencha Ext JS framework from here.
Once the download is done, unzip the file. Then navigate through templates\admin-dashboard. Here, you will find the source code of the admin dashboard.
Wrapping Up
Now you have learned to build an admin dashboard with JavaScript. Keep visiting our blog to find more tutorials on building cross-platform web applications.


Latest Content
How to Handle Millions of Rows in a React Data Grid: Buffered Rendering and Server-Side Data
A React data grid that feels instant with 1,000 rows can freeze with 100,000 and…
October 16, 2026

How to Choose a React Grid Component: 12 Features Enterprise Apps Need
Picking a React grid component looks easy in week one. Every option sorts columns and…
October 16, 2026
Enterprise React Data Grid: The Features Enterprise Teams Need, and What Each Grid Includes
Almost every enterprise React data grid advertises the same features: grouping, pivoting, Excel export, clipboard,…
October 16, 2026