


 Ask Sencha AI
Sneak Peek: Sencha Visual Studio Code Plugin
November 1, 2016
2409 Views
Get a summary of this article:
We’re just days away from SenchaCon 2016, where we’ll be introducing a brand new Ext JS tool – a plugin for Microsoft Visual Studio Code source editor. Join Ryan Salva, Microsoft Principal Program Manager, and me for our session: Learn Cross-Platform Mobile App Development with Cordova and Visual Studio.
You’ll learn how you can use Visual Studio Code and Sencha Visual Studio Code plugin to speed up your Ext JS app development. We’ll cover the top features of Visual Studio Code, Sencha Visual Studio Code plugin, and use Microsoft extensions to create and debug mobile applications.
Don’t have your ticket yet for SenchaCon 2016? Register today because tomorrow is the last day for online registration.
Now, I’m going to show you how to debug Ext JS apps using Microsoft Visual Studio Code extension – Debugger for Chrome.
Debugging Ext JS Apps with Visual Studio Code
Debugging apps using breakpoints, stepping through code, and watching variables is very common in Java and .Net development environments, but good tools for web developers are limited. Microsoft Visual Studio Code provides an extension called “Debugger for Chrome” that helps you with debugging Ext JS web apps.
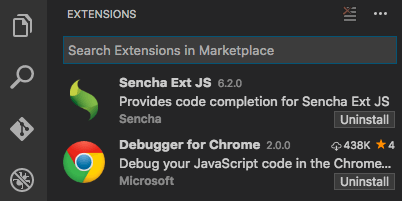
To get started, go to Visual Studio Code, and just search for and install “Debugger for Chrome” extension.
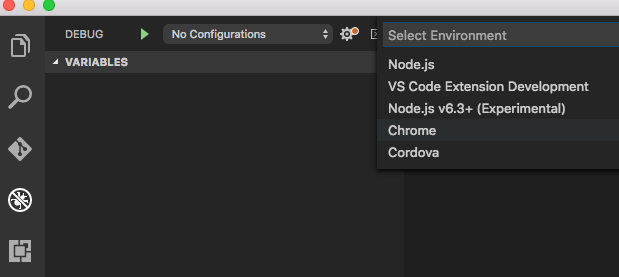
From the Debug tab, select Configure, and select Chrome.
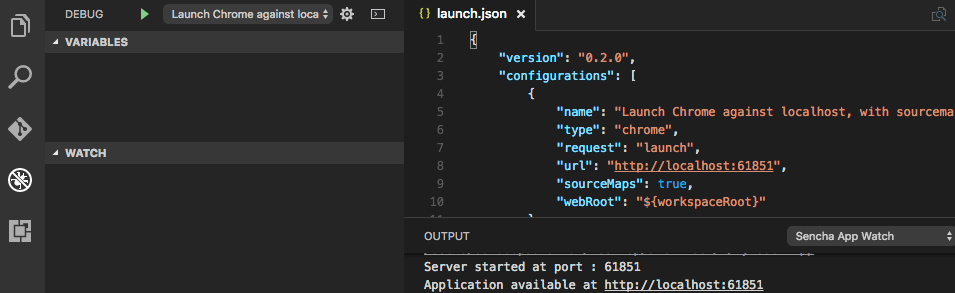
Visual Studio Code will now create an initial launch configuration. Please update the URL in the launch.json to point to your Ext JS app.
Launch Chrome with remote debugging enabled, so the extension attaches to it. In a terminal, execute /Applications/Google\ Chrome.app/Contents/MacOS/Google\ Chrome –remote-debugging-port=9222
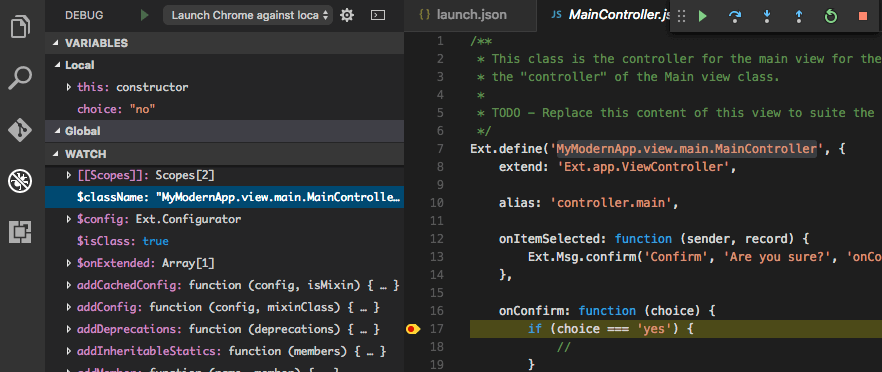
Now, you can start debugging (F5), add breakpoints, step through Ext JS code, and watch the call stack.
Join us at SenchaCon for our session, where we’ll show you all of the details and how to use Visual Studio Code plugin.
If you’re interested in what’s new in Architect 4.1 and Themer 1.1, I have another SenchaCon session, Web Development at the Speed of Thought: Succeeding in the App Economy, where I’ll go over speeding up development using various Ext JS tools including Architect, Themer, Sencha Inspector, and Stencils.
See you in Las Vegas!


Latest Content

What Is DORA? A Complete Guide to the EU's Digital Operational Resilience Act (2026)
Last Updated: June 2026 The Digital Operational Resilience Act (DORA) is one of the most…
June 17, 2026

Top 8 Best Practices for Enterprise Software Development in 2026
Enterprise software development in 2026 demands a different approach than consumer application development. Enterprise teams…
June 3, 2026
JavaScript Framework vs Library: Key Differences Explained for 2026
JavaScript frameworks and libraries serve different purposes in enterprise development. Frameworks such as Ext JS…
June 3, 2026


