


 Ask Sencha AI
Easily Build Powerful Interactive Data Visualizations Using D3 And JavaScript
May 11, 2021
3096 Views
Get a summary of this article:
The D3 package in Sencha ExtJS enables you to create interactive data visualization easily. By utilizing it, you can present the data more effectively in your web application. As a result, individuals and companies can easily uncover valuable insights. In this post, you will know the details of creating powerful data visualizations using two components: D3 Pack and D3 Hierarchy.
What is D3?
D3 (Data Driven Components) is an open-source JavaScript library. It enables you to create interactive data visualizations in web browsers using SVG, HTML5, and CSS.
D3 allows you to bind any kind of data to the Document Object Model (DOM) and make the data interactive by applying data-driven transformation effectively. It supports a plethora of APIs. As a result, you can create and implement beautiful data visualization to your web application easily. There is also D3 heat map support.
How can I build Interactive Data Visualization with D3 and Ext JS?
The Sencha D3 package is completely integrated with Ext JS. So, you can build interactive data visualization conveniently. Also, you can implement it with your Ext JS web application quickly. There are various component types in the D3 package. But in this tutorial, we will focus on two types of components: D3 Pack and D3 Words.
D3 Pack
As the name suggests, this component utilizes D3’s pack layout. It enables you to visualize hierarchical data as an enclosure diagram. Here is an example:
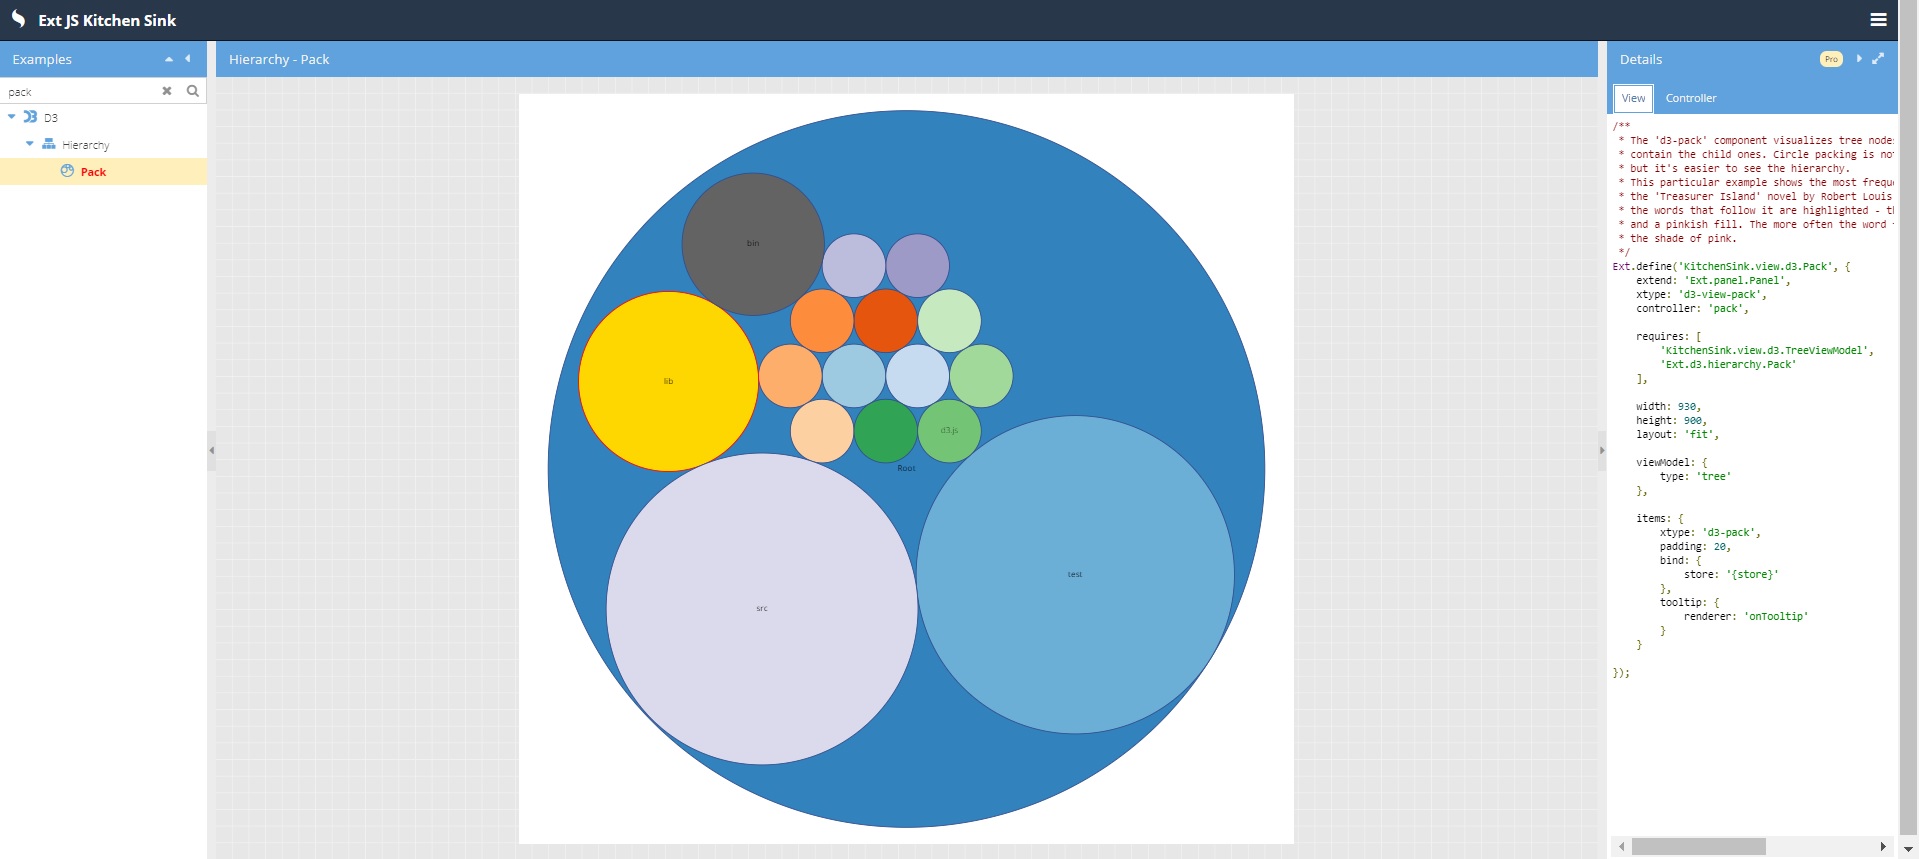
To create the visualization shown above, you have to follow these steps:
1. First, you have to create the View using these codes:
Ext.define('KitchenSink.view.d3.Pack', {
extend: 'Ext.panel.Panel',
xtype: 'd3-view-pack',
controller: 'pack',
requires: [
'KitchenSink.view.d3.TreeViewModel',
'Ext.d3.hierarchy.Pack'
],
width: 930,
height: 900,
layout: 'fit',
viewModel: {
type: 'tree'
},
items: {
xtype: 'd3-pack',
padding: 20,
bind: {
store: '{store}'
},
tooltip: {
renderer: 'onTooltip'
}
}
});
Here, you are defining the height and width of the visualization. Also, you are binding the data to store.
2. Next, you have to create the Controller. Simply add these codes:
Ext.define('KitchenSink.view.d3.PackController', {
extend: 'Ext.app.ViewController',
alias: 'controller.pack',
requires: [
'Ext.util.Format'
],
onTooltip: function (component, tooltip, node, element, event) {
var size = node.get('size'),
n = node.childNodes.length;
if (size) {
tooltip.setHtml(Ext.util.Format.fileSize(size));
} else {
tooltip.setHtml(n + ' file' + (n === 1 ? '' : 's') + ' inside.');
}
}
});
Here, you are defining the function for specifying the size of the nodes.
You can find the demo here.
D3 Words
With the D3 Words component, you can visualize the frequently used words through a customized word cloud where a parent circles contain the child ones. Here is an example:
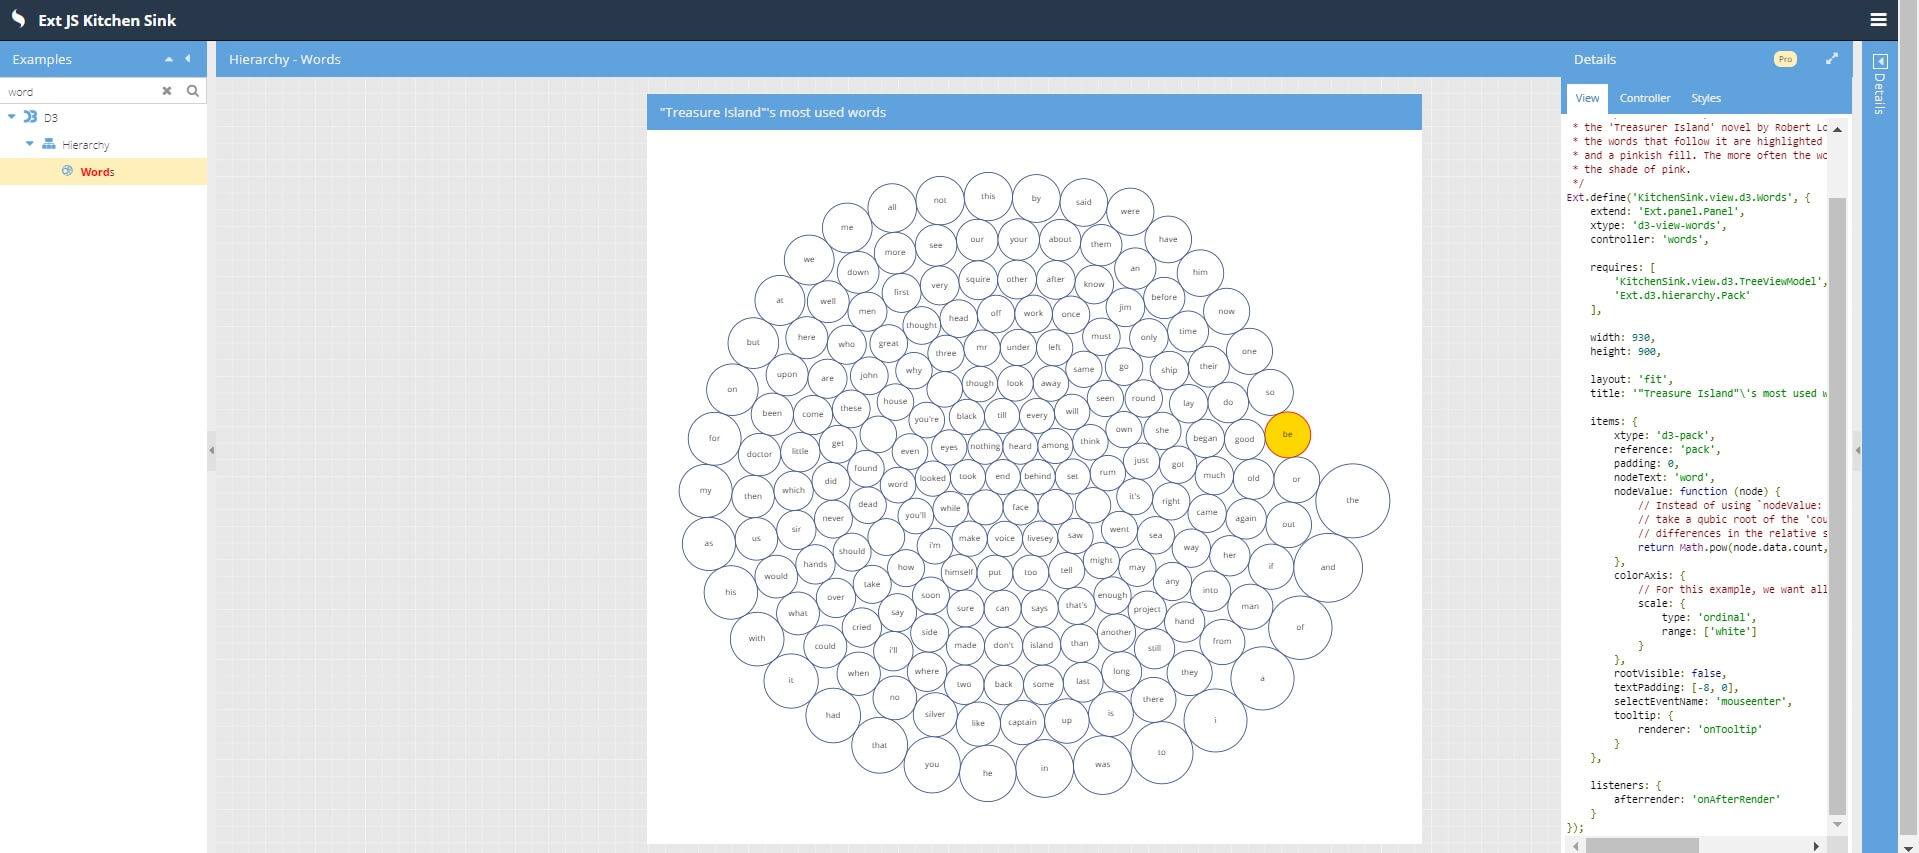
The visualization reveals the most used words of a novel, called “Treasure Island.” You can create it quickly by simply following these steps:
1. Create the View with these codes:
Ext.define('KitchenSink.view.d3.Words', {
extend: 'Ext.panel.Panel',
xtype: 'd3-view-words',
controller: 'words',
requires: [
'KitchenSink.view.d3.TreeViewModel',
'Ext.d3.hierarchy.Pack'
],
width: 930,
height: 900,
layout: 'fit',
title: '"Treasure Island"\'s most used words',
items: {
xtype: 'd3-pack',
reference: 'pack',
padding: 0,
nodeText: 'word',
nodeValue: function (node) {
// Instead of using `nodeValue: 'count'` as a config,
// take a qubic root of the 'count' to downplay
// differences in the relative size of nodes.
return Math.pow(node.data.count, 1/3);
},
colorAxis: {
// For this example, we want all nodes to have the same color.
scale: {
type: 'ordinal',
range: ['white']
}
},
rootVisible: false,
textPadding: [-8, 0],
selectEventName: 'mouseenter',
tooltip: {
renderer: 'onTooltip'
}
},
listeners: {
afterrender: 'onAfterRender'
}
});
2. Then you have to create the Controller. Add these codes:
Ext.define('KitchenSink.view.d3.WordsController', {
extend: 'Ext.app.ViewController',
alias: 'controller.words',
requires: [
'Ext.util.Format'
],
textUrl: 'data/treasure_island.txt',
onAfterRender: function () {
var me = this,
pack = me.lookupReference('pack');
Ext.Ajax.request({
url: me.textUrl
}).then(function (response) {
var text = response.responseText
.replace(/[,|.|:|;|_|!|?|\n|"]/g, ' ') // replace unwanted characters with spaces
.replace(/\s\s+/g, ' ') // replace multiple spaces with a single space
.toLowerCase(),
words = text.split(' '),
map = me.countWords(words), // count frequency of occurrence of words
word, entry;
for (word in map) {
entry = map[word];
// count frequency of occurrence of words that follow each word
entry.nextMap = me.countWords(entry.nextList, map);
}
pack.setStore(
Ext.create('Ext.data.TreeStore', {
data: me.getTopWords(map, 200)
})
);
});
},
countWords: function (words, previous) {
var ln = words.length - 1, // last word doesn't count :p
map = {},
i, word, entry;
for (i = 0; i < ln; i++) {
word = words;
if (map.hasOwnProperty(word)) {
entry = map[word];
entry.count++;
if (!previous) {
entry.nextList.push(words);
}
} else {
entry = map[word] = {
word: previous && previous.hasOwnProperty(word) ? previous[word] : word,
count: 1
};
if (!previous) {
entry.nextList = [words];
}
}
}
return map;
},
// The data structure produced by the `countWords` method is a map of Entries
// in the following format: { <word>: Entry }, where the Entry is:
//
// Entry {
// word: String // the word
// count: Number // how often the word occurs in the text
// topNextWord: Object // most popular next word (in the same format as in the 'nextMap')
// nextList: String[ // array of all words that follow this word (can contain duplicates)
// <nextWord>,
// <nextWord>,
// ...
// ]
// nextMap: { // a map of all the next words
// <nextWord>: {
// word: Entry, // a next word that follows this word (as another Entry)
// count: Number // how often the next word follows this word
// }
// }
// }
getTopWords: function (map, count) {
var words = [],
word, top, i, ln,
nextMap, nextKey, nextValue,
topNextWord, max;
for (word in map) {
words.push(map[word]);
}
words.sort(function (w1, w2) {
return w2.count - w1.count;
});
count = Math.min(words.length, count);
top = words.slice(0, count);
for (i = 0, ln = top.length; i < ln; i++) {
nextMap = top.nextMap;
max = 0;
for (nextKey in nextMap) {
nextValue = nextMap[nextKey];
if (top.indexOf(nextValue.word) === -1) {
delete nextMap[nextKey];
} else {
if (nextValue.count > max) {
max = nextValue.count;
topNextWord = nextValue;
}
}
}
top.topNextWord = topNextWord;
}
return top;
},
onTooltip: function (component, tooltip, node, element, event) {
var me = this,
word = node.get('word'),
count = node.get('count'),
pack = me.lookupReference('pack'),
nodes = me.nodes || (me.nodes = pack.getRenderedNodes()),
nextMap = node.data.nextMap,
topNextWord = node.data.topNextWord,
tip = 'The word <strong>' + word + '</strong> is used ' + count + ' times.'
+ '<br>It is most often followed by the <strong>' + topNextWord.word.word + '</strong> word'
+ '<br>for a total of ' + topNextWord.count + ' times.',
nextKey, nextValue, entry;
// Create a color scale that will give us a shade of pink depending on how
// often a given word follows the howevered word.
me.scale = me.scale || d3.scale.linear().range(['white', '#bd3163']);
me.scale.domain([0, topNextWord.count]);
// Reset the color of all nodes back to white...
nodes.select('circle')
.style('fill', 'white')
.style('stroke-width', 1);
// ... except for the color of the selected node - we want that to come from the CSS.
pack.selectNode(pack.getSelection()).select('circle').style('fill', null);
for (nextKey in nextMap) {
nextValue = nextMap[nextKey];
entry = nextValue.word;
if (entry.word !== node.data.word) {
// Highlight the words that most frequently follow the hovered word.
pack.selectNode(entry).select('circle')
.style('fill', me.scale(nextValue.count))
.style('stroke-width', 3);
}
}
tooltip.setHtml(tip);
}
});
Here, you are creating methods for several functionalities, like counting the number of words and getting the top words. Also, you are applying different styles.
3. Finally, you have to specify the font-weight with these lines:
.#{$d3-prefix}hierarchy .#{$d3-prefix}node.#{$d3-prefix}parent .#{$d3-prefix}label {
font-weight: normal;
}
You can view the demo right here.
How can I build more powerful Javascript visualizations?
That’s how you create interactive data visualization using D3. As you can see, the JavaScript library makes the entire process fast and simple. Keep in touch with us to find more ways of visualizing the data effectively.
Sencha Ext JS is a feature-rich JavaScript framework for building interactive web applications. Try it now to build cross-platform web apps.


Latest Content

JS Days Is Back: A Free Virtual Conference for JavaScript Developers
Sencha is bringing back JS Days, a free, two-day online conference for JavaScript developers. Dates:…
July 2, 2026

What Is DORA? A Complete Guide to the EU's Digital Operational Resilience Act (2026)
Last Updated: June 2026 The Digital Operational Resilience Act (DORA) is one of the most…
June 17, 2026

Top 8 Best Practices for Enterprise Software Development in 2026
Enterprise software development in 2026 demands a different approach than consumer application development. Enterprise teams…
June 3, 2026


