



 Ask Sencha AI
Quickly Build Amazing Cryptocurrency Charts In JavaScript With Coinlayer API And Sencha Ext JS
April 18, 2021
3674 Views
Get a summary of this article:
With the virtual explosion of cryptocurrency, there is a strong need for software services offering reliable cryptocurrency data in real-time. For most of the cryptos, the pricing and exchange rates would not be the same every day. There is uncertainty. With Sencha ExtJS and Coinlayer API, you can quickly build amazing cryptocurrency charts, which can help the investors uncover valuable insights about the market conveniently. In this post, you will find all the details about working with the Ext JS javascript web framework.
What is Coinlayer?
Coinlayer is the most trusted and authoritative cryptocurrency API. It offers actual crypto rates for over 385 cryptocurrencies. The data are taken from the top 25 exchange markets. So, the rates are guaranteed to be accurate.
Why should you use Coinlayer for creating cryptocurrency charts?
- Provides real-time cryptocurrency data with the highest level of accuracy
- Offers quick response time (up to 20 milliseconds)
- Supports industry-standard 256-bit HTTPS encryption for data security
- Offers JSONExchange rates
- Provides easy-to-follow integration guides and interactive API documentation
How to Build Amazing Cryptocurrency Charts Using Sencha ExtJS and Coinlayer
ExtJS is a powerful JavaScript framework for building data-intensive applications. By integrating the Coinlayer with your ExtJS app, you can build amazing cryptocurrency charts quickly and conveniently. Here is an example of a cryptocurrency box plot:
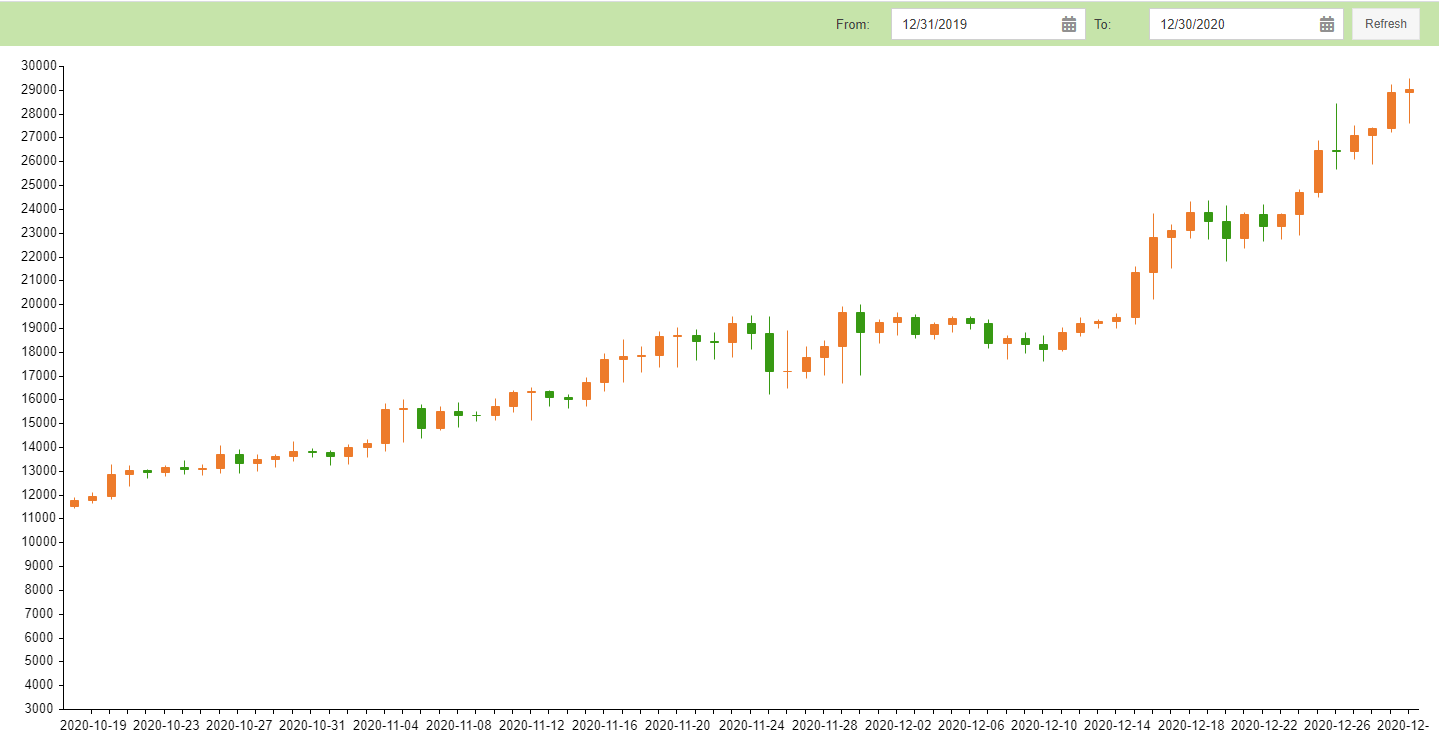
To create the box plot shown above, you have to follow these steps:
1. First, you have to create the Model using the following codes:
Ext.define('Demo.model.HomeModel', {
extend: 'Ext.data.Model',
alternateClassName: [
'home'
],
requires: [
'Ext.data.field.Number'
],
fields: [
{
type: 'float',
name: 'cap'
},
{
type: 'float',
name: 'vol'
},
{
type: 'float',
name: 'low'
},
{
type: 'float',
name: 'high'
},
{
type: 'float',
name: 'sup'
},
{
type: 'float',
name: 'rate'
},
{
type: 'int',
name: 'date'
},
{
type: 'float',
name: 'close'
}
]
});
Here, you are adding the name and specifying the type of the required fields.
2. Next, you have to create the View Controller:
Ext.define('Demo.view.HomePanelViewController', {
extend: 'Ext.app.ViewController',
alias: 'controller.homepanel',
updateUI: function(startDate, endDate) {
console.log(startDate, endDate);
if(!startDate || !endDate){
startDate = '2020-01-01';
endDate = '2020-12-31';
}
if(this.isVaildPeriod(startDate, endDate)) {
var mycandlestickchart = Ext.ComponentQuery.query('#mycandlestickchart')[0];
var store = mycandlestickchart.getStore();
store.proxy.extraParams.start_date = startDate;
store.proxy.extraParams.end_date = endDate;
store.load({
scope:this,
callback: function(records, operation, success) {
console.log("records", records);
store.setData(records);
console.log("getData", store.getData());
}
});
}
},
isVaildPeriod: function(startDate, endDate) {
startDate = new Date(startDate);
endDate = new Date(endDate);
if(startDate.getTime() > endDate.getTime()) {
var temp = endDate;
endDate = startDate;
startDate = temp;
}
console.log("endDate - startDate", endDate - startDate);
var days = Math.round((endDate - startDate) / (24 * 3600 * 1000));
console.log("days", days);
if(days > 365 || days === 0) {
Ext.Msg.alert('Alert', 'You can see only for a year(365days)', Ext.emptyFn);
return false;
} else {
return true;
}
},
onRefreshBtnClick: function(button, e, eOpts) {
var fromDatePicker = Ext.ComponentQuery.query('#fromDatePicker')[0];
var fromDate = fromDatePicker.value;
var toDatePicker = Ext.ComponentQuery.query('#toDatePicker')[0];
var toDate = toDatePicker.value;
if(fromDate && toDate) {
fromDate = new Date(fromDate);
toDate = new Date(toDate);
if(fromDate > toDate) {
var temp = toDate;
toDate = fromDate;
fromDate = temp;
}
fromDate = Ext.Date.format(fromDate, 'Y-m-d');
toDate = Ext.Date.format(toDate, 'Y-m-d');
this.updateUI(fromDate, toDate);
}
},
onPanelAfterRender: function(component, eOpts) {
this.updateUI();
}
});
Here, you are creating different conditions to display the cryptocurrency data based on the range of dates.
3. Now, it’s time for creating the View Model:
Ext.define('Demo.view.HomePanelViewModel', {
extend: 'Ext.app.ViewModel',
alias: 'viewmodel.homepanel',
alternateClassName: [
'homepanel'
]
});
4. Then you have to create the View. Simply add these codes:
Ext.define('Demo.view.HomePanel', {
extend: 'Ext.panel.Panel',
alias: 'widget.homePanel',
alternateClassName: [
'homePanel'
],
requires: [
'Demo.view.HomePanelViewModel',
'Demo.view.HomePanelViewController',
'Ext.toolbar.Toolbar',
'Ext.toolbar.Fill',
'Ext.form.field.Date',
'Ext.button.Button',
'Ext.chart.navigator.Container',
'Ext.chart.navigator.Navigator',
'Ext.chart.axis.Time',
'Ext.chart.series.CandleStick',
'Ext.chart.interactions.Crosshair'
],
controller: 'homepanel',
viewModel: {
type: 'homepanel'
},
dock: 'top',
height: '100vh',
padding: 0,
style: {
background: '#ffffff'
},
width: '100wh',
layout: 'fit',
bodyPadding: 0,
frameHeader: false,
manageHeight: false,
dockedItems: [
{
xtype: 'toolbar',
alignTarget: '',
border: 2,
dock: 'top',
style: {
background: '#c6e4aa'
},
layout: {
type: 'hbox',
padding: '0 10 0 0'
},
items: [
{
xtype: 'tbfill'
},
{
xtype: 'datefield',
id: 'fromDatePicker',
width: 250,
fieldLabel: 'From',
labelWidth: 50,
value: '01/01/2020'
},
{
xtype: 'datefield',
id: 'toDatePicker',
resizable: false,
width: 250,
fieldLabel: 'To',
labelWidth: 50,
value: '12/31/2020'
},
{
xtype: 'button',
id: 'refreshBtn',
text: 'Refresh',
listeners: {
click: 'onRefreshBtnClick'
}
}
]
}
],
items: [
{
xtype: 'chartnavigator',
padding: 10,
header: false,
title: 'My Panel',
navigator: {
colors: [
'#115fa6',
'#94ae0a',
'#a61120',
'#ff8809',
'#ffd13e',
'#a61187',
'#24ad9a',
'#7c7474',
'#a66111'
],
axis: 'bottom'
},
chart: {
xtype: 'cartesian',
dock: 'top',
height: '60vh',
id: 'mycandlestickchart',
itemId: 'mycandlestickchart',
margin: '0 0 0 0',
width: '100vw',
colors: [
'#115fa6',
'#94ae0a',
'#a61120',
'#ff8809',
'#ffd13e',
'#a61187',
'#24ad9a',
'#7c7474',
'#a66111'
],
store: 'BtcRateDataJsonPStore',
innerPadding: {
top: 0,
left: 10,
right: 10,
bottom: 0
},
axes: [
{
type: 'time',
fields: [
'date'
],
id: 'bottom',
position: 'bottom'
},
{
type: 'numeric',
fields: [
'cap',
'vol',
'low',
'high',
'sup',
'rate'
],
position: 'left'
}
],
series: [
{
type: 'candlestick',
style: {
barWidth: 7,
dropStyle: {
fill: 'rgb(237,123,43)',
stroke: 'rgb(237,123,43)'
},
raiseStyle: {
fill: 'rgb(55,153,19)',
stroke: 'rgb(55,153,19)'
}
},
xField: 'date',
closeField: 'close',
highField: 'high',
lowField: 'low',
openField: 'rate'
}
],
interactions: [
{
type: 'crosshair',
axes: {
bottom: {
label: {
fillStyle: 'white'
},
rect: {
fillStyle: '#344459',
opacity: 0.7,
radius: 5
}
},
left: {
label: {
fillStyle: 'white'
},
rect: {
fillStyle: '#344459',
opacity: 0.7,
radius: 5
}
}
}
}
]
}
}
],
listeners: {
afterrender: 'onPanelAfterRender'
}
});
Here, you are specifying a variety of information, including chart type and label. Also, you are applying different styles by specifying the color of the background and chart navigator.
5. Now, you have to create the Controller:
Ext.define('Demo.controller.MyController', {
extend: 'Ext.app.Controller',
alternateClassName: [
'home'
]
});
6. Then you have to get the Coinlayer API access key. You can find it for free by signing up on Coinlayer’s website.
7. We would like to build a box plot specifically for Bitcoin. To do it, you have to go to the app folder and create a new folder, called store. Then create a new file, called BtcRateDataJsonPStore.js, and add these codes:
Ext.define('Demo.store.BtcRateDataJsonPStore', {
extend: 'Ext.data.Store',
alias: 'store.BtcRateDataStore',
alternateClassName: [
'btcratedatastore'
],
requires: [
'Demo.model.HomeModel',
'Ext.data.proxy.JsonP',
'Ext.data.reader.Json',
'Ext.data.field.Number'
],
constructor: function(cfg) {
var me = this;
cfg = cfg || {};
me.callParent([Ext.apply({
storeId: 'BtcRateDataJsonPStore',
model: 'Demo.model.HomeModel',
proxy: {
type: 'jsonp',
extraParams: {
access_key: '94ba88431b0310b32ddc1af867f90a57',
start_date: '2020-01-01',
end_date: '2020-12-31',
target: 'USD',
symbols: 'BTC',
expand: 1
},
url: 'https://api.coinlayer.com/timeframe',
reader: {
type: 'json',
transform: function(data) {
// console.log("response", data);
var newData = [];
var rates = data.rates;
var dates = Object.keys(rates);
var firstDate = dates[0];
var nextOpen = rates[firstDate].BTC.rate || 0; // init
// adjust for 07-21;
if(rates["2020-07-21"]) {
var tempRate = rates["2020-07-21"];
if(tempRate.BTC && tempRate.BTC.high > 100000) {
tempRate.BTC.high = (tempRate.BTC.high) / 100;
}
console.log("tempRate", tempRate);
rates["2020-07-21"] = tempRate;
}
newData = dates.map((date) => {
var btc = rates[date].BTC;
btc.date = new Date(date).getTime();
btc.close = nextOpen;
nextOpen = btc.rate;
return btc;
});
// console.log("newData", newData);
return newData;
}
}
},
fields: [
{
type: 'float',
name: 'rate'
},
{
type: 'float',
name: 'sup'
},
{
type: 'float',
name: 'high'
},
{
type: 'float',
name: 'low'
},
{
type: 'float',
name: 'vol'
},
{
type: 'float',
name: 'cap'
},
{
type: 'int',
name: 'date'
},
{
type: 'float',
name: 'close'
}
]
}, cfg)]);
}
});
Integrating the Coinlayer API with the ExtJS App
Keep in mind that you are adding the access key of Coinlayer API, which you obtained at Step 6, by using these codes:
extraParams: {
access_key: '94ba88431b0310b32ddc1af867f90a57',
Also, take a look at this code:
url: 'https://api.coinlayer.com/timeframe',
That’s it! Now, you have built a cryptocurrency box plot specifically for Bitcoin, which looks like this:
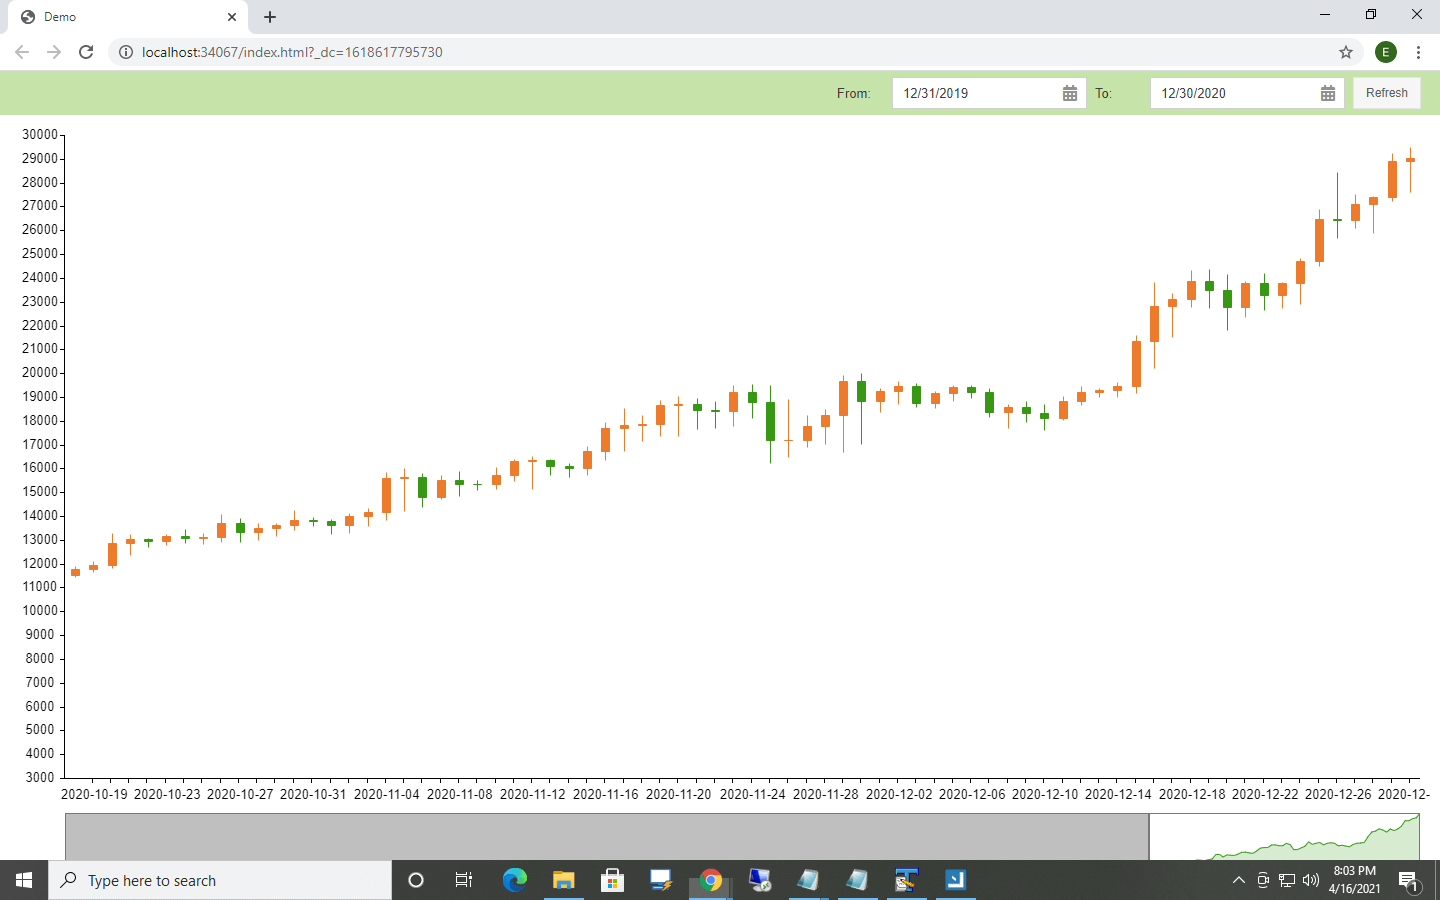
You can find the source code here.
To launch the project, you will need to download and install Sencha Architect. It offers a free trial.
Once the installation is done, you will have to open the project on Sencha Architect. Then you have to build and preview it. The cryptocurrency box plot will be displayed on your web browser.
Wrapping Up
Now, you have learned to create a cryptocurrency chart that pulls in and displays data from the Coinlayer API. You can use the same method for incorporating the crypto data visualization feature to your smartphone or web application using JavaScript in Sencha ExtJS.


Latest Content

How to Handle Millions of Rows in a React Data Grid: Buffered Rendering and Server-Side Data
A React data grid that feels instant with 1,000 rows can freeze with 100,000 and…
October 16, 2026

How to Choose a React Grid Component: 12 Features Enterprise Apps Need
Picking a React grid component looks easy in week one. Every option sorts columns and…
October 16, 2026

Enterprise React Data Grid: The Features Enterprise Teams Need, and What Each Grid Includes
Almost every enterprise React data grid advertises the same features: grouping, pivoting, Excel export, clipboard,…
October 16, 2026