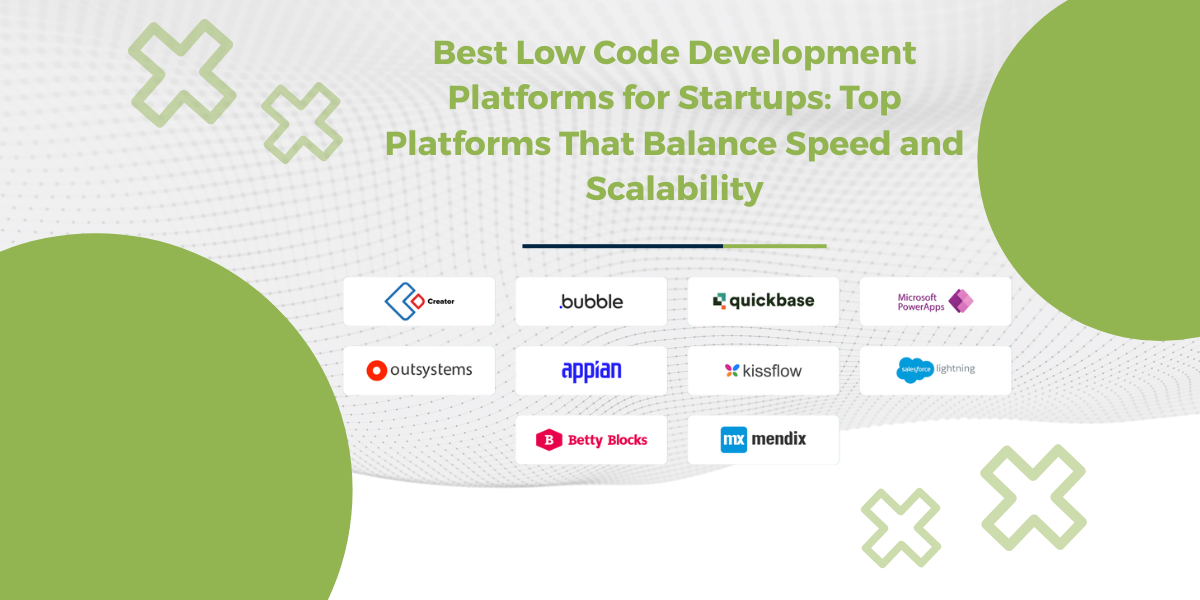
Introducing React ReExt – Sencha Ext JS Components in React! LEARN MORE

Javascript Grid: Cell Binding, Grid Sparklines, Charts, And More Tips And Tricks

May 18, 2021 113 Views
Show

An important part of web application development is displaying data in the most efficient way possible. You must ensure that the users can wade through your data and efficiently find what they are looking for effortlessly. Because of this, Ext JS Javascript Grid Library has several useful features that help you create tables, sparklines, and charts quickly. If you want to learn how you can use Ext JS Grid to present your data effectively, read on for details.

What is Ext JS Grid?

As you likely know, Sencha Ext JS Grid is a powerful component for manipulating and displaying data onscreen. It helps you to fetch, sort, and filter large amounts of data easily. By using it, you can quickly implement amazing features, like Infinite Scrolling, into your web app.

How can I do Cell Binding with the Javascript Ext JS Grid?

Cell binding is a powerful tool in Ext JS Grid. You can use cell binding to create formulas that automatically set cell styles. As an example, take a look at this table of Flight Arrivals:

Take A Look At This Table Of Flight Arrivals

To create the table shown above use the following code:

// x-red, x-green and x-blue are non-standard, defined dynamically at the bottom.

Ext.define('MyApp.view.Main', {

extend: 'Ext.grid.Grid',

title: 'Reykjavik Flight Arrivals',

itemConfig: {

    viewModel: {


        formulas: {


            toolHeartIconCls: function(get) {return get('record.favorite') ? 'x-fa fa-heart x-red' : 'x-fa fa-heart';},


            toCellCls: {

                bind: '{record.to}',

                get: function(to){

                    return ['x-red', 'x-green', 'x-blue'][Ext.Number.randomInt(0, 2)];

                }

            }


        }


    }

},

items: [{

    xtype: 'label',

    docked: 'top',

    margin: 4,

    html: '<i class="fa fa-square x-green"></i> Early &nbsp;&nbsp;&nbsp;<i class="fa fa-square x-blue"></i> On-time &nbsp;&nbsp;&nbsp;<i class="fa fa-square x-red"></i> Late'

}],

columns: [{

    text: 'Date',

    xtype: 'datecolumn',

    dataIndex: 'date',

    format: 'F j'

}, {

    xtype: 'gridcolumn',

    text: 'Airline',

    dataIndex: 'airline',

    width: 120

}, {

    text: 'To',

    dataIndex: 'to',

    cell: {

        bind: {

            cls: '{toCellCls}'

        }

    },

    width: 160

}, {

    text: 'Scheduled',

    dataIndex: 'plannedDeparture',

    align: 'center'

}, {

    text: 'Favorite',

    cell: {

        tools: [{

            bind: {

                iconCls: '{toolHeartIconCls}'

            },

            handler: function(grid, context) {

                context.record.set('favorite', !context.record.data.favorite);

            }

        }]

    },

    align: 'center'

}],


store: {

    type: 'store',

    autoLoad: true,

    fields: [{name: 'date',type: 'date',dateFormat: 'j. M'}],

    proxy: {

        type: 'ajax',

        url: 'departures.json',

        reader: {rootProperty: 'results'}

    }

}

});

Ext.application({

name: 'MyApp',

mainView: 'MyApp.view.Main',

launch: function(){

    var css = Ext.util.CSS.createStyleSheet();

    Ext.util.CSS.createRule(css, '.x-red', 'color:red !important;');

    Ext.util.CSS.createRule(css, '.x-green', 'color:green !important;');

    Ext.util.CSS.createRule(css, '.x-blue', 'color:blue !important;');


}

});

For another approach, you can use a view model formula to determine cell and tool CSS styles.

Take a look at this portion of the code to see how:

            toCellCls: {

                bind: '{record.to}',

                get: function(to){

                    return ['x-red', 'x-green', 'x-blue'][Ext.Number.randomInt(0, 2)];

                }

Here, destination (to) is passed to the function. It can return different flight statuses, including Early,  On-time, and Late, which are represented by ‘x-green’, ‘x-blue’, and ‘x-red’.

You can play with the code at Sencha Fiddle.

How can I build Sparklines with a Javascript Grid?

Sparklines are another useful way to present information. In Ext JS Grid, you can place Sparklines easily. Let’s take a look at this example:

In Ext JS Grid, You Can Place Sparklines Easily

Here, you can place sparklines easily by simply clicking on one of the options available in Sencha Ext JS Grid. Tour style choices include Line, Box, and Bullet. To add the same functionality to your web application, you can use this code:

Ext.define('Fiddle.view.Main', {

extend: 'Ext.Panel',

title: 'Choose a Sparkline',

padding: 16,

layout: {

    type: 'vbox',

    align: 'start'

},

scrollable: true,

defaults: {

    margin: 8

},

referenceHolder: true,

items: [{

    xtype: 'textfield',

    reference: 'values',

    label: 'Values',

    labelWidth: 50,

    value: '6,10,4,-3,7,2', // Comma-delimited numbers only!

}, {

    xtype: 'segmentedbutton',

    reference: 'type',

    items: [

        {value: 'sparklineline',     text: 'Line'},

        {value: 'sparklinebox',      text: 'Box'},

        {value: 'sparklinebullet',   text: 'Bullet'},

        {value: 'sparklinediscrete', text: 'Discrete'},

        {value: 'sparklinepie',      text: 'Pie'},

        {value: 'sparklinetristate', text: 'TriState'}

    ],

    listeners: {

        change: 'up.insertSparkline'

    }

},{

    xtype: 'container',

    reference: 'sparklines',

    defaults: {

        margin: 8,

        padding: 8,

        style: 'border: thin solid gray'

    },

    layout: {

        type: 'hbox',

        wrap: true

    }

}],

insertSparkline: function (segmentedButton, value) {

    const old = this.down('sparkline');

    const s = this.lookup('values').getValue().replace(/\s/g, '');

    const values = s.split(',').map(val => Number(val));

    const config = {

        xtype: 'container',

        layout: 'hbox',

        defaults: {

            margin: 4

        },

        items: [{

            xtype: 'label',

            html: values.join(', ')

        }, {

            xtype: value,

            values: values,

            height: 25,

            width: 100

        }]

    };

    this.lookup('sparklines').add(config);

}

});

Ext.application({

name: 'Fiddle',

mainView: 'Fiddle.view.Main'

});

Want to try for yourself? You can find the source code here.

How can I build powertful Javascript Charts with Ext JS Grid?

Nothing helps you to effectively reveal important information to your users more than charts. By utilizing Ext JS Grid, you can create beautiful charts. Here is an example:

By Utilizing Ext JS Grid, You Can Create Beautiful Charts. Here Is An Example

You can create the chart shown above in EXT JS Grid by using this code:

Ext.define('MyApp.view.Main', {

    extend: 'Ext.Panel',

    layout: {

        type: 'vbox',

        align: 'stretch'

    },

    viewModel: {

        stores: {

            dashboard : {type:'dashboard'}

        }

    },

    referenceHolder: true,

    items: [{

        xtype: 'container',

        flex: 1,

        layout: {

            type: 'hbox',

            align: 'stretch'

        },

        items: [{

            xtype: 'cartesian',

            reference: 'barChart',

            bind: '{dashboard}',

            flex: 1,

            interactions: ['itemhighlight'],

            animation: {

                easing: 'easeOut',

                duration: 300

            },

            axes: [{

                type: 'numeric',

                position: 'left',

                fields: 'price',

                minimum: 0,

                hidden: true

            }, {

                type: 'category',

                position: 'bottom',

                fields: ['name'],

                label: {

                    fontSize: 11,

                    rotate: {

                        degrees: -45

                    },

                    renderer: 'onBarChartAxisLabelRender'

                }

            }],

            series: [{

                type: 'bar',

                label: {

                    display: 'insideEnd',

                    field: 'price',

                    orientation: 'vertical',

                    textAlign: 'middle'

                },

                xField: 'name',

                yField: 'price'

            }],

            listeners: {

                itemhighlight: 'up.onChartHighlight'

            }

        }, {

            // Radar chart will render information for a selected company in the list.

            xtype: 'polar',

            reference: 'radarChart',

            flex: 1,

            store: {

                fields: ['Name', 'Data'],

                data: [

                    { 'Name': 'Price', 'Data': 100 },

                    { 'Name': 'Revenue %', 'Data': 100 },

                    { 'Name': 'Growth %', 'Data': 100 },

                    { 'Name': 'Product %', 'Data': 100 },

                    { 'Name': 'Market %', 'Data': 100 }

                ]

            },

            theme: 'Blue',

            interactions: 'rotate',

            insetPadding: '15 30 15 30',

            axes: [{

                type: 'category',

                position: 'angular',

                grid: true,

                label: {

                    fontSize: 10

                }

            }, {

                type: 'numeric',

                miniumum: 0,

                maximum: 100,

                majorTickSteps: 5,

                position: 'radial',

                grid: true

            }],

            series: [{

                type: 'radar',

                xField: 'Name',

                yField: 'Data',

                showMarkers: true,

                marker: {

                    radius: 4,

                    size: 4,

                },

                style: {

                    opacity: 0.5,

                    lineWidth: 0.5

                }

            }]

        }]

    }, {

        xtype: 'container',

        flex: 1,

        layout: {

            type: 'hbox',

            align: 'stretch'

        },

        items: [{

            xtype: 'grid',

            reference: 'grid',

            listeners: {

                select: 'up.onGridSelect'

            },

            flex: 2,

            bind: {

                store: '{dashboard}'

            },

            columns: [{

                text: 'Company',

                flex: 1,

                dataIndex: 'name'

            }, {

                text: 'Price',

                width: null,

                dataIndex: 'price',

                formatter: 'usMoney'

            }, {

                text: 'Revenue',

                width: null,

                dataIndex: 'revenue',

                renderer: 'onColumnRender'

            }, {

                text: 'Growth',

                width: null,

                dataIndex: 'growth',

                renderer: 'onColumnRender',

                hidden: true

            }, {

                text: 'Product',

                width: null,

                dataIndex: 'product',

                renderer: 'onColumnRender',

                hidden: true

            }, {

                text: 'Market',

                width: null,

                dataIndex: 'market',

                renderer: 'onColumnRender',

                hidden: true

            }]

        }]

    }],

    onChartHighlight: function(chart, item) {


        if (item) {

            var grid = this.lookup('grid');

            grid.ensureVisible(item.record, {

                select: true

            });

        }

    },

    onGridSelect: function(grid, records){

        var record = records[0];

        if (record){

            this.highlightCompanyPriceBar(record);

            this.updateRadarChart(record);

        }

    },

    updateRadarChart: function(record) {

        var chart = this.lookup('radarChart'),

            store = chart.getStore();

        store.setData([

            { Name: 'Price', Data: record.get('price') },

            { Name: 'Revenue %', Data: record.get('revenue') },

            { Name: 'Growth %', Data: record.get('growth') },

            { Name: 'Product %', Data: record.get('product') },

            { Name: 'Market %', Data: record.get('market') }

        ]);

    },

    highlightCompanyPriceBar: function(record) {

        var barChart = this.lookup('barChart'),

            store = barChart.getStore(),

            series = barChart.getSeries()[0];

        barChart.setHighlightItem(series.getItemByIndex(store.indexOf(record)));

        return this;

    },

    });

    // Mock up some data

    Ext.define('KitchenSink.store.Dashboard', {

    extend: 'Ext.data.Store',

    alias: 'store.dashboard',

    fields: [

        { name: 'name' },

        { name: 'price', type: 'float' },

        { name: 'revenue', type: 'float' },

        { name: 'growth', type: 'float' },

        { name: 'product', type: 'float' },

        { name: 'market', type: 'float' }

    ],

    data: (function() {

        var data = [

                ['3M Co'],

                ['AT&T Inc'],

                ['Boeing Co.'],

                ['Citigroup, Inc.'],

                ['Coca-Cola'],

                ['General Motors'],

                ['IBM'],

                ['Intel'],

                ['McDonald\'s'],

                ['Microsoft'],

                ['Verizon'],

                ['Wal-Mart']

            ],

            i, l, item, rand;

        for (i = 0, l = data.length, rand = Math.random; i < l; i++) {

            item = data;

            item[1] = Ext.util.Format.number(((rand() * 10000) >> 0) / 100, '0');

            item[2] = ((rand() * 10000) >> 0) / 100;

            item[3] = ((rand() * 10000) >> 0) / 100;

            item[4] = ((rand() * 10000) >> 0) / 100;

            item[5] = ((rand() * 10000) >> 0) / 100;

        }

        return data;

    })()

    });

    Ext.application({

    name: 'MyApp',

    mainView: 'MyApp.view.Main'

    })

You can experiment further with the code here.

What Javascript tips and tricks for grids are there?

Locked Columns

Because there are so many ways to display data in Ext JS Grid, you are only limited by your imagination. To illustrate another one of your options, you can create locked columns easily. Here is an example:

With Ext JS Grid, You Can Create Locked Columns Easily. Here Is An Example

To build this locked column, you have to use the following lines:

Ext.define('MyApp.view.Main', {

extend: 'Ext.grid.locked.Grid',

title: 'Reykjavik Flight Departures',


columns: [{


    locked: true, // true, 'left' or 'right'

    text: 'Airline',

    dataIndex: 'airline',

    width: 240

}, {

    xtype: 'datecolumn',

    locked: true,

    text: 'Date',

    dataIndex: 'date',

    format: 'M j, Y',

    width: 120

}, {

    text: 'To',

    dataIndex: 'to',

    width: 200

}, {

    text: 'Scheduled',

    dataIndex: 'plannedDeparture',

    align: 'center'

}, {

    text: 'Status',

    dataIndex: 'realDeparture',

    width: 200

}, {

    text: 'Summary',

    tpl: 'On {date:date("F j")}, <tpl if="airline">{airline}<tpl else>a</tpl> flight to {to} is scheduled to depart at {plannedDeparture}.',

    dataIndex: 'airline', // This determines the sort sequence

    width: 300

}],


store: {

    type: 'store',

    autoLoad: true,

    fields: [{name: 'date',type: 'date',dateFormat: 'j. M'}],

    proxy: {

        type: 'ajax',

        url: 'departures.json',

        reader: {rootProperty: 'results'}}

}


});


Ext.application({

name: 'MyApp',

mainView: 'MyApp.view.Main'

});

Here, in the columns that you want to lock, you must set locked to true

looking for the source code? Find it here.

How can I build Infinite Scrolling Javascript grids?

Where you have a large amount of data to display, you may want to try Infinite Scrolling. In Ext JS Grid, Infinite Scrolling lets your users scroll through thousands of records smoothly. Here is an example:

Infinite Scrolling Enables The Users To Scroll Down Thousands Of Records Smoothly. Here Is An Example

You can implement Infinite Scrolling functionality in your web application using the following code example:

Ext.define('MyApp.view.Main', {

extend: 'Ext.grid.Grid',

title: 'Businesses',


columns: [

    { xtype: 'rownumberer', width: 55},

    { text: 'Name',  dataIndex: 'name', flex : 2},

    { text: 'Address', dataIndex: 'full_address', flex : 3  },

    { text: 'City', dataIndex: 'city', flex: 1 }

],


store: {

    type: 'virtual',

    pageSize: 200,

    proxy : { type : 'ajax', url : '//nameless-tundra-27404.herokuapp.com/go/?fn=bigdata', reader : { type : 'json', rootProperty : 'data' } },

    autoLoad: true

}


});

Ext.application({

name: 'MyApp',

mainView: 'MyApp.view.Main'

});

Play around more with the code here.

Where can I get this powerful Javascript Grid?

As you can see, Sencha Ext JS Grid gives you the power to efficiently display data to the users through charts and sparklines. Also, it lets you leverage other useful functionality like Locked Columns and Infinite Scrolling. If you want to find out more check out the Ext JS Grid documentation.

Sencha Ext JS is a powerful JavaScript library for building interactive web applications. Try it now for free and create your own data-intensive web apps.

Show
Start building with Ext JS today

Build 10x web apps faster with 140+ pre-build components and tools.

Latest Content
Discover the Top 07 Architecture Patterns used in Modern Enterprise Software Development

Developing software without an architecture pattern may have been an option back then. However, that’s…

JavaScript Design Patterns: A Hands-On Guide with Real-world Examples

As a web developer, you know how popular JavaScript is in the web app development…

Virtual JS Days 2024のハイライト

2024年2月20日~22日、第3回目となる「Virtual JavaScript Days」が開催されました。JavaScript の幅広いトピックを採り上げた数多くのセッションを実施。その内容は、Senchaの最新製品、ReExt、Rapid Ext JSまで多岐にわたり、JavaScriptの最新のサンプルも含まれます。 このカンファレンスでは多くのトピックをカバーしています。Senchaでセールスエンジニアを務めるMarc Gusmano氏は、注目すべきセッションを主催しました。Marc は Sencha の最新製品「ReExt」について、詳細なプレゼンテーションを実施。その機能とメリットを、参加者に理解してもらうべく詳細に説明しました。 カンファレンスは、Senchaのジェネラルマネージャを務めるStephen Strake氏によるキーノートでスタートしました。キーノートでは、会社の将来のビジョンについての洞察を共有しています。世界中から JavaScript 開発者、エンジニア、愛好家が集まるとてもエキサイティングなイベントとなりました。これは、JavaScript…

See More