



 Ask Sencha AI
How Technology Is Changing How We Treat D3 Heat Maps
April 12, 2022
2914 Views
Get a summary of this article:
Sencha Ext JS is a JavaScript framework for creating data-intensive, cross-platform online and mobile applications for any modern device. It gives developers access to a number of fantastic libraries. Sencha Ext JS’s D3 package has many useful components. You can use them to generate fantastic data visualizations that will help your company uncover vital business insights. In this article, we’ll look at one of the most useful native Ext JS components, the D3 heat map. We will show you how technology has made it more essential than ever.
What is the Importance of D3 in Ext JS?
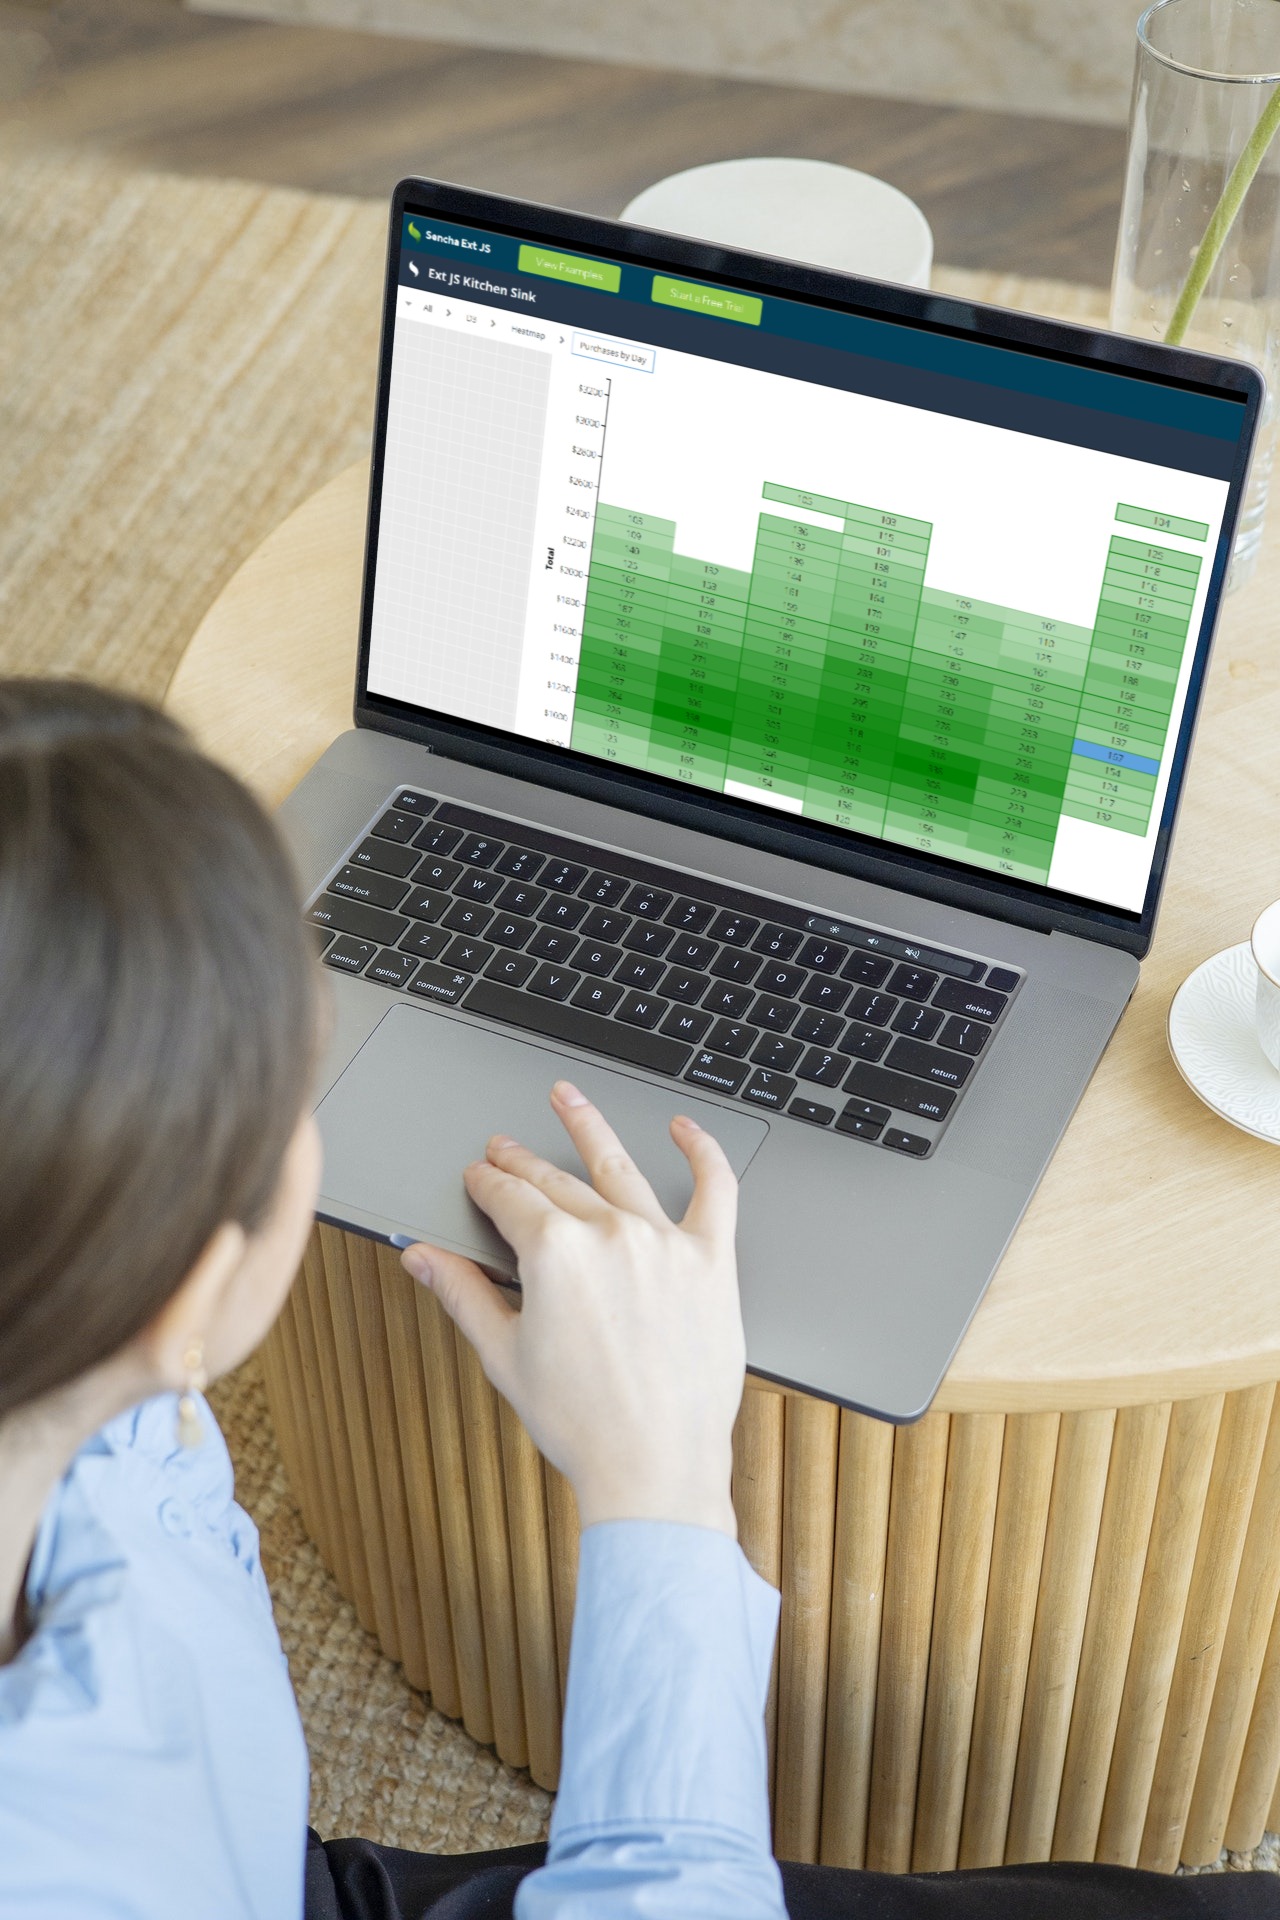
A good application presents its data clearly and appealingly. D3 is a popular way of accomplishing this. Moreover, the D3 package makes integrating D3 into your Ext JS application even more straightforward than before. D3 is a JavaScript package with a lot of features. It allows you to create dynamic and interactive data visualizations using modern web standards in your web browser. SVG, HTML, and CSS are examples of these standards. D3 is also free and open-source, so you can use it without investing a dime.
What are Heatmaps?
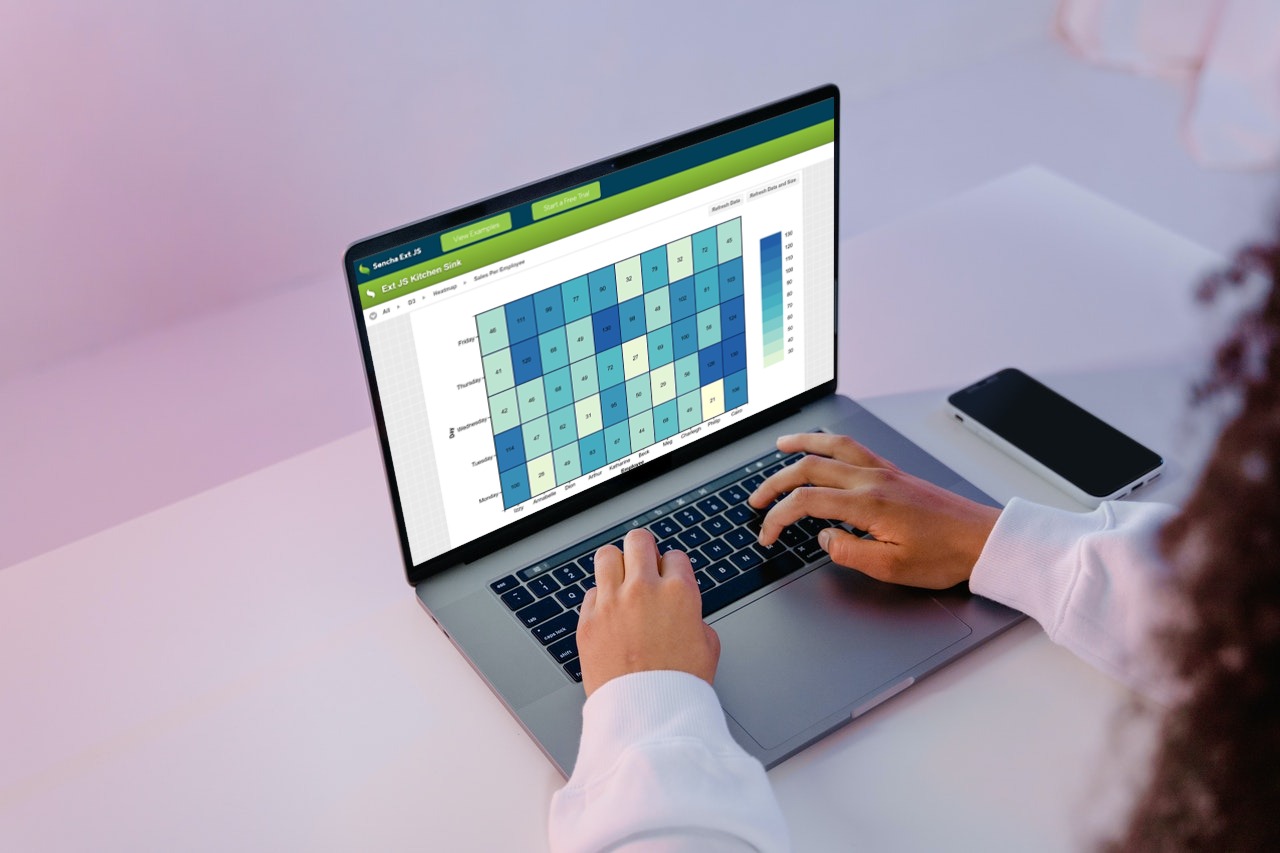
A heatmap (or heat map) is a graphical representation of data with color-coded values. They’re crucial for determining what works and doesn’t work on a website or product page.
Heatmaps allow you to evaluate your product’s performance and increase user engagement and retention by experimenting with how particular buttons and items are placed on your website. This enables you to prioritize the tasks that will increase customer value. Heatmaps make it simple to view and understand complex data at a glance. Website and product heatmaps use a range of colors, red to blue, to depict the most popular (hot) and least popular (cold) aspects of your site’s website content.
These plots help you identify trends and optimize your product and site to increase user engagement and sales. They do this by aggregating user behavior and providing a snapshot of how your target audience interacts with an individual website or product page by combining quantitative and qualitative data.
How is D3 Heat Map Affected by the Shift in the Technological Landscape?

The ‘d3-heatmap’ component is used to display matrices with individual values expressed as colors. Ext.d3.axis is used twice in this component. You can easily visualize complex data, such as multidimensional arrays, using the Sencha Ext JS D3-heatmap component. Heatmaps are a visual representation of matrices with individual values represented as colors. Today heatmaps are very popular!
Fiddle is a web application that allows you to create, run, and share code examples using the Ext JS framework. Fiddle is compatible with the same systems and browsers as Ext JS 6.2.0. It features an online IDE and a view of your running example without the need to install anything locally.
The following code generates one of the most basic heat maps:
Ext.create('Ext.panel.Panel', {
renderTo: Ext.getBody(),
title: 'Heatmap Chart',
height: 750,
width: 750,
layout: 'fit',
items: [
{
xtype: 'd3-heatmap',
padding: {
top: 20,
right: 30,
bottom: 20,
left: 80
},
xAxis: {
axis: {
ticks: 'd3.time.days',
tickFormat: "d3.time.format('%b %d')",
orient: 'bottom'
},
scale: {
type: 'time'
},
title: {
text: 'Date'
},
field: 'date',
step: 24 * 60 * 60 * 1000
},
yAxis: {
axis: {
orient: 'left'
},
scale: {
type: 'linear'
},
title: {
text: 'Total'
},
field: 'bucket',
step: 100
},
colorAxis: {
scale: {
type: 'linear',
range: ['white', 'orange']
},
field: 'count',
minimum: 0
},
tiles: {
attr: {
'stroke': 'black',
'stroke-width': 1
}
},
store: {
fields: [
{name: 'date', type: 'date', dateFormat: 'Y-m-d'},
'bucket',
'count'
],
data: [
{ "date": "2012-07-20", "bucket": 800, "count": 119 },
{ "date": "2012-07-20", "bucket": 900, "count": 123 },
{ "date": "2012-07-20", "bucket": 1000, "count": 173 },
{ "date": "2012-07-20", "bucket": 1100, "count": 226 },
{ "date": "2012-07-20", "bucket": 1200, "count": 284 },
{ "date": "2012-07-21", "bucket": 800, "count": 123 },
{ "date": "2012-07-21", "bucket": 900, "count": 165 },
{ "date": "2012-07-21", "bucket": 1000, "count": 237 },
{ "date": "2012-07-21", "bucket": 1100, "count": 278 },
{ "date": "2012-07-21", "bucket": 1200, "count": 338 },
{ "date": "2012-07-22", "bucket": 900, "count": 154 },
{ "date": "2012-07-22", "bucket": 1000, "count": 241 },
{ "date": "2012-07-22", "bucket": 1100, "count": 246 },
{ "date": "2012-07-22", "bucket": 1200, "count": 300 },
{ "date": "2012-07-22", "bucket": 1300, "count": 305 },
{ "date": "2012-07-23", "bucket": 800, "count": 120 },
{ "date": "2012-07-23", "bucket": 900, "count": 156 },
{ "date": "2012-07-23", "bucket": 1000, "count": 209 },
{ "date": "2012-07-23", "bucket": 1100, "count": 267 },
{ "date": "2012-07-23", "bucket": 1200, "count": 299 },
{ "date": "2012-07-23", "bucket": 1300, "count": 316 },
{ "date": "2012-07-24", "bucket": 800, "count": 105 },
{ "date": "2012-07-24", "bucket": 900, "count": 156 },
{ "date": "2012-07-24", "bucket": 1000, "count": 220 },
{ "date": "2012-07-24", "bucket": 1100, "count": 255 },
{ "date": "2012-07-24", "bucket": 1200, "count": 308 },
{ "date": "2012-07-25", "bucket": 800, "count": 104 },
{ "date": "2012-07-25", "bucket": 900, "count": 191 },
{ "date": "2012-07-25", "bucket": 1000, "count": 201 },
{ "date": "2012-07-25", "bucket": 1100, "count": 238 },
{ "date": "2012-07-25", "bucket": 1200, "count": 223 },
{ "date": "2012-07-26", "bucket": 1300, "count": 132 },
{ "date": "2012-07-26", "bucket": 1400, "count": 117 },
{ "date": "2012-07-26", "bucket": 1500, "count": 124 },
{ "date": "2012-07-26", "bucket": 1600, "count": 154 },
{ "date": "2012-07-26", "bucket": 1700, "count": 167 }
]
}
}
]
});
You can even generate a slightly more complicated heatmap right now by simply clicking here. The code below generates a D3 SVG Heatmap:
Ext.define('KitchenSink.view.d3.custom.svg.DayHourHeatMap', {
extend: 'Ext.panel.Panel',
xtype: 'd3-view-day-hour-heatmap',
controller: 'day-hour-heatmap',
requires: [
'Ext.d3.svg.Svg'
],
width: 960,
height: 520,
layout: 'fit',
items: [{
xtype: 'd3',
padding: '50 0 100 30',
listeners: {
sceneresize: 'onSceneResize'
}
}]
});
Ext.define('KitchenSink.view.d3.DayHourHeatMapController', {
extend: 'Ext.app.ViewController',
alias: 'controller.day-hour-heatmap',
datasets: [
'heatmap1.tsv',
],
onDataset1: function () {
this.heatmapChart(this.datasets[0]);
},
onSceneResize: function (component, scene, size) {
var width = size.width,
height = size.height,
gridSize = Math.floor(width / 24),
legendElementWidth = gridSize * 2,
buckets = 9,
colors = ['#ffffd9','#edf8b1','#c7e9b4','#7fcdbb','#41b6c4','#1d91c0','#225ea8','#253494','#081d58'],
days = ['Mo', 'Tu', 'We', 'Th', 'Fr', 'Sa', 'Su'],
times = ['1a', '2a', '3a', '4a', '5a', '6a', '7a', '8a', '9a', '10a', '11a', '12a', '1p', '2p', '3p', '4p', '5p', '6p', '7p', '8p', '9p', '10p', '11p', '12p'];
scene.classed('d3-heatmap', true);
var dayLabels = scene.selectAll('.dayLabel')
.data(days)
.enter().append('text')
.text(function (d) { return d; })
.attr('x', 0)
.attr('y', function (d, i) { return i * gridSize; })
.style('text-anchor', 'end')
.attr('transform', 'translate(-6,' + gridSize / 1.5 + ')')
.attr('class', function (d, i) { return ((i >= 0 && i <= 4) ? 'dayLabel mono axis axis-workweek' : 'dayLabel mono axis'); });
var timeLabels = scene.selectAll('.timeLabel')
.data(times)
.enter().append('text')
.text(function (d) { return d; })
.attr('x', function (d, i) { return i * gridSize; })
.attr('y', 0)
.style('text-anchor', 'middle')
.attr('transform', 'translate(' + gridSize / 2 + ', -6)')
.attr('class', function (d, i) { return ((i >= 7 && i <= 16) ? 'timeLabel mono axis axis-worktime' : 'timeLabel mono axis'); });
this.heatmapChart = function (tsvFile) {
d3.tsv(tsvFile,
function (d) {
return {
day: +d.day,
hour: +d.hour,
value: +d.value
};
},
function (error, data) {
var colorScale = d3.scaleQuantile()
.domain([0, buckets - 1, d3.max(data, function (d) { return d.value; })])
.range(colors);
var cards = scene.selectAll('.hour')
.data(data, function (d) {return d.day+':'+d.hour;});
// First time we are here, the update selection will be empty.
// During subsequent calls, the enter selection will be empty.
// The exit selection is always going to be empty in this example,
// as we will be reusing elements. Still, it's a good practice
// to take care of it, just in case.
cards.exit().remove();
cards.enter().append('rect')
.attr('x', function (d) { return (d.hour - 1) * gridSize; })
.attr('y', function (d) { return (d.day - 1) * gridSize; })
.attr('rx', 4)
.attr('ry', 4)
.attr('class', 'hour bordered')
.attr('width', gridSize)
.attr('height', gridSize)
.style('fill', colors[0])
// In D3 4.x selections are now immutable (enter does not mutate update)
.merge(cards) // so we merge enter and update selections manually
.transition().duration(1000)
.style('fill', function (d) { return colorScale(d.value); });
var legend = scene.selectAll('.legend')
.data([0].concat(colorScale.quantiles()), function (d) { return d; });
legend.exit().remove();
legend = legend.enter().append('g')
.attr('class', 'legend')
.merge(legend);
legend.append('rect')
.attr('x', function (d, i) { return legendElementWidth * i; })
.attr('y', height)
.attr('width', legendElementWidth)
.attr('height', gridSize / 2)
.style('fill', function (d, i) { return colors; });
legend.append('text')
.attr('class', 'mono')
.text(function (d) { return '≥ ' + Math.round(d); })
.attr('x', function (d, i) { return legendElementWidth * i; })
.attr('y', height + gridSize);
});
};
this.heatmapChart(this.datasets[0]);
}
});
Ext.application({
name: 'MyApp',
mainView: 'KitchenSink.view.d3.custom.svg.DayHourHeatMap'
});
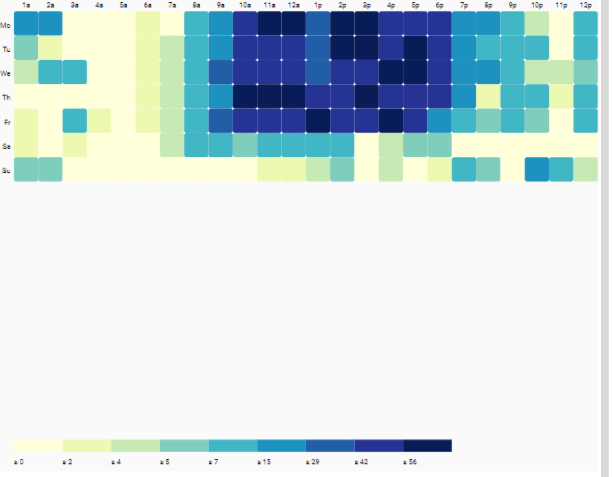
This code will give us the following heatmap:
Ready to start working with heat maps?
Heat maps are a wonderful way to quickly communicate project progress or demonstrate relationships between two data sets. A heat map can be used as a quick assessment tool to assist, identify, and set priorities. With the evolution of technologies and the need for better analysis, the demand for D3 heat maps has also increased. Now is the moment to start using heat mapping technology to increase your website’s aesthetic appeal and performance, whether you’re a web designer or a website owner.
Click here to access the best resource for starting with D3 heat maps.


Latest Content

How to Handle Millions of Rows in a React Data Grid: Buffered Rendering and Server-Side Data
A React data grid that feels instant with 1,000 rows can freeze with 100,000 and…
October 16, 2026

How to Choose a React Grid Component: 12 Features Enterprise Apps Need
Picking a React grid component looks easy in week one. Every option sorts columns and…
October 16, 2026

Enterprise React Data Grid: The Features Enterprise Teams Need, and What Each Grid Includes
Almost every enterprise React data grid advertises the same features: grouping, pivoting, Excel export, clipboard,…
October 16, 2026