



 Ask Sencha AI
Best JavaScript Libraries for Data Grids, Charts and Dashboards
Nov 12, 2026
104 Views
Get a summary of this article:
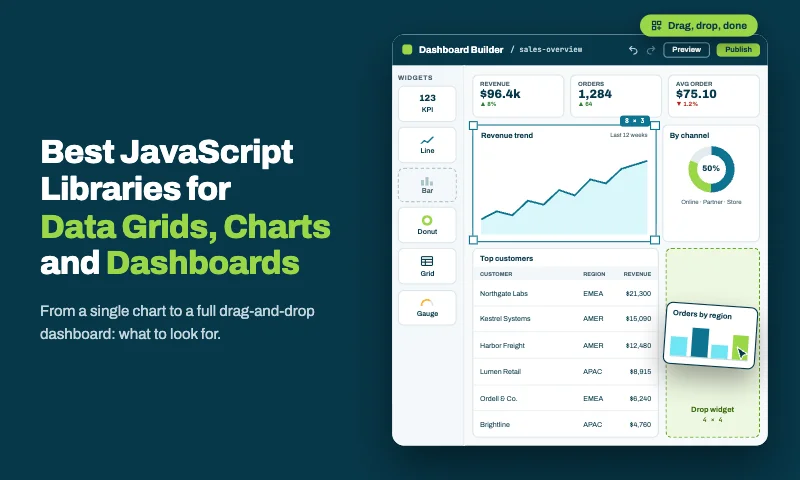
Data grids, charts and dashboards are where most business applications earn their keep, and where the choice of JavaScript libraries matters most. Pick well and a team ships a reporting screen in days. Pick poorly and the same team spends months on a grid that can’t group, a chart that doesn’t match it, and glue code that holds the two together.
This guide covers the best JavaScript libraries for data grids, charts and dashboards going into 2027: what each one does well, where it falls short, how it’s licensed, and which kind of team it suits. It closes with the question most lists skip: what happens when you need all three on the same screen.
How we chose
Each library was judged on what matters for business applications:
- Features for real work: grouping, editing and large datasets for grids; interactivity and chart range for charts.
- Performance at scale: how well it handles large datasets in the browser and from the server.
- Fit with other components: how easily it works alongside grids, charts, forms and layouts on one screen.
- Licensing: open source, commercial, or free tier plus paid features.
- Longevity: release history, maintenance and support options.
Quick picks
| Need | Best overall for enterprise apps | Best free option | Best low-level option |
|---|---|---|---|
| Data grid | Ext JS Grid | AG Grid Community or Tabulator | TanStack Table |
| Charts | Ext JS Charts (with Ext JS grids and dashboards) or Highcharts | Apache ECharts or Chart.js | D3 |
| Dashboards | Ext JS (grids, charts, layouts and data in one framework) | Gridstack.js plus your chosen grid and chart libraries | Your own layout with CSS Grid |
Best JavaScript data grid libraries
1. Ext JS Grid
What it is. The data grid at the heart of Ext JS, Sencha’s framework for data-intensive applications, now on version 8.
Strengths. One of the most complete grids available: buffered rendering for large datasets, server-side sorting, filtering and paging, multi-level grouping with summaries, cell and row editing with validation, locked columns, spreadsheet-style selection and clipboard, tree grids, and a pivot grid. It’s backed by Ext JS’s data package (models, stores and proxies) and shares one theme with Ext JS charts, forms and layouts.
Watch-outs. It’s part of a commercial framework, not a standalone free download, and it follows Ext JS conventions rather than plain HTML tables.
License. Commercial, as part of Ext JS Pro, Enterprise and Ultimate subscriptions. React teams can use it through ReExt.
Best for. Data-intensive enterprise application development where the grid is the main workspace and sits alongside charts, forms and complex layouts.
2. AG Grid
What it is. A widely used standalone data grid with versions for plain JavaScript and major frameworks.
Strengths. Strong performance, a large feature set and a big user base. The free Community edition covers sorting, filtering, editing, CSV export and pagination.
Watch-outs. Features enterprise apps often need, including row grouping, aggregation, pivoting, Excel export, range selection, clipboard operations and master-detail, are in the commercial Enterprise edition. It’s a grid only, so charts, forms and layouts come from elsewhere.
License. Community edition under MIT; Enterprise edition commercial.
Best for. Teams that want a dedicated, best-in-class grid and plan to source the rest of the ui components separately.
3. Handsontable
What it is. A spreadsheet-like data grid that looks and feels like Excel.
Strengths. Formulas, cell-level editing, copy and paste, and a familiar spreadsheet experience for users who think in cells rather than records.
Watch-outs. Built around spreadsheet interaction rather than record-oriented grids; free use is limited to non-commercial and evaluation purposes.
License. Commercial license for commercial use.
Best for. Data-entry and planning tools where users expect spreadsheet behavior.
4. Tabulator
What it is. A free, framework-agnostic JavaScript table library.
Strengths. Plain JavaScript library, no framework required, with sorting, filtering, grouping, editing and virtual rendering included at no cost.
Watch-outs. Community-maintained, with no commercial support contract; advanced enterprise features and polish vary.
License. MIT.
Best for. Teams that need a capable free grid in plain JavaScript or server-rendered pages.
5. TanStack Table
What it is. A headless table library: it provides the logic for sorting, filtering, grouping, pagination and more, and you render every part of the UI.
Strengths. Complete control over markup and styling, with adapters for React, Vue, Solid, Svelte and others.
Watch-outs. Editing, clipboard, export, accessibility and the rendered grid are your team’s work, and virtualization comes from a separate library.
License. MIT.
Best for. Teams with strong front-end capacity and highly custom design requirements.
Best JavaScript chart libraries
1. Ext JS Charts
What it is. The charting package in Ext JS, with Cartesian charts (bar, line, area, scatter and financial series), polar charts (pie and radar) and gauges.
Strengths. Charts read from the same Ext JS stores as grids, so filtering or editing data updates both at once. Built-in interactions include highlighting, tooltips, legends, and pan and zoom, and charts share one theme with the rest of the app.
Watch-outs. Part of the commercial Ext JS framework rather than a standalone free chart library; teams that only need a few charts on a static page may not need it.
License. Commercial, as part of Ext JS.
Best for. Dashboards and reporting screens where charts sit next to grids and forms and must stay in sync with them.
2. Apache ECharts
What it is. A powerful open-source charting library from the Apache Software Foundation.
Strengths. A very wide range of chart types, good performance with large datasets, maps, and rich interactions, at no cost.
Watch-outs. A large configuration surface with a learning curve, and integration with grids and forms is up to you.
License. Apache 2.0.
Best for. Teams that need a free library with many chart types and strong performance.
3. Highcharts
What it is. A long-established commercial charting library with stock, map and Gantt variants.
Strengths. Polished charts, strong accessibility features, extensive documentation and commercial support.
Watch-outs. A commercial license is required for commercial use, and it covers charts only.
License. Commercial for commercial use; free for some non-commercial uses.
Best for. Organizations that want a supported, chart-only library with a very broad set of chart types.
4. Chart.js
What it is. A popular, lightweight open-source charting library built on HTML canvas.
Strengths. Simple to learn, small, and good-looking out of the box for common chart types.
Watch-outs. Fewer advanced chart types and interactions than the libraries above; very large datasets need care.
License. MIT.
Best for. Straightforward charts on pages and simpler dashboards.
5. D3
What it is. A low-level toolkit for building custom, data-driven visualizations.
Strengths. Nearly unlimited flexibility: if you can design it, you can build it with D3.
Watch-outs. It’s a toolkit, not a chart library. Every chart is built by hand, which takes specialist skills and time.
License. ISC (open source).
Best for. Custom and unusual visualizations that standard chart types can’t express. Ext JS also offers a D3 adapter in its Enterprise edition for teams that want D3 inside an Ext JS app.
Building dashboards: layout libraries vs one framework
A dashboard isn’t a single component. It’s a grid, several charts, KPI panels, filters and a layout that holds them together, all reading the same data. There are two ways to get there.
Option 1: Assemble libraries
Pick a grid, a chart library and a layout library such as Gridstack.js (MIT), which provides draggable, resizable dashboard tiles. Then connect them yourself: load the data, feed it to the grid and each chart in their own formats, and re-feed every component when a filter or edit changes the data.
This works, and it gives you free choice of each piece. The cost is the integration code, three themes to align, and three upgrade schedules to track.
Option 2: One framework for grid, charts, layout and data
Ext JS provides all four together. Its grid and charts read from the same store, its layouts provide resizable and collapsible regions, and its data binding keeps everything in sync. Here’s a small sales dashboard in plain Ext JS. Filtering the grid filters the shared store, and the chart above it updates automatically:
    Ext.define('App.view.SalesDashboard', {
      extend: 'Ext.panel.Panel',
      xtype: 'salesdashboard',
      title: 'Sales dashboard',
      layout: 'border',

      viewModel: {
        stores: {
          sales: {
            fields: ['month', { name: 'revenue', type: 'float' }, { name: 'orders', type: 'int' }],
            autoLoad: true,
            proxy: { type: 'ajax', url: '/api/sales', reader: { type: 'json', rootProperty: 'data' } },
          },
        },
      },

      items: [{
        region: 'center',
        xtype: 'cartesian',
        bind: { store: '{sales}' },
        legend: { docked: 'bottom' },
        interactions: ['itemhighlight'],
        axes: [
          { type: 'numeric', position: 'left', grid: true },
          { type: 'category', position: 'bottom' },
        ],
        series: [{ type: 'bar', xField: 'month', yField: 'revenue', title: 'Revenue' }],
      }, {
        region: 'south',
        xtype: 'grid',
        height: 260,
        split: true,
        collapsible: true,
        title: 'Monthly detail',
        bind: { store: '{sales}' },
        plugins: [{ ptype: 'gridfilters' }],
        columns: [
          { text: 'Month', dataIndex: 'month', width: 120, filter: 'list' },
          { text: 'Orders', dataIndex: 'orders', width: 110, filter: 'number' },
          { text: 'Revenue', dataIndex: 'revenue', flex: 1, xtype: 'numbercolumn',
            format: '$0,000', filter: 'number' },
        ],
      }],
    });
No code connects the chart to the grid: they share the sales store, so a filter applied in one shows up in both. Ext JS also includes a dashboard component with movable, resizable parts for tile-style layouts.
For React teams, ReExt brings these same Ext JS grids, charts, and layouts into React, as covered in 10 React UI Components Every Enterprise Dashboard Needs.
All libraries at a glance
| Library | Category | License | Works without a framework | Also covers | Best for |
|---|---|---|---|---|---|
| Ext JS | Grid, charts, dashboards (full framework) | Commercial | Yes; in React via ReExt | Forms, trees, layouts, data layer | Data-intensive enterprise apps |
| AG Grid | Data grid | MIT Community; commercial Enterprise | Yes | Integrated charting (Enterprise) | A dedicated, standalone grid |
| Handsontable | Spreadsheet-style grid | Commercial for commercial use | Yes | Formulas | Spreadsheet-like data entry |
| Tabulator | Data grid | MIT | Yes | Nothing beyond tables | A free grid in plain JavaScript |
| TanStack Table | Headless table logic | MIT | Through framework adapters | Nothing; you render the UI | Fully custom table designs |
| Apache ECharts | Charts | Apache 2.0 | Yes | Maps | Free, wide-ranging charts |
| Highcharts | Charts | Commercial for commercial use | Yes | Stock, map and Gantt charts | Supported, polished charts |
| Chart.js | Charts | MIT | Yes | Nothing beyond charts | Simple, lightweight charts |
| D3 | Visualization toolkit | ISC | Yes | Anything you build | Custom visualizations |
| Gridstack.js | Dashboard layout | MIT | Yes | Draggable, resizable tiles | Tile layouts for assembled dashboards |
How to choose
Start with how many of the three you need on the same screens:
- Only a grid, with simple surroundings: a dedicated grid such as AG Grid, Tabulator or TanStack Table may be enough. Check which tier includes the features you need.
- Only charts, on reports or pages: ECharts or Chart.js for free options, Highcharts for a supported commercial one, D3 for custom visuals.
- Grids, charts and dashboards together, across many screens: weigh the cost of integrating separate libraries against one framework where they share data, theme and layout. For data-intensive applications, that’s where Ext JS stands out.
Then check three things for every finalist: performance with your real data volume, which license tier covers your must-have features, and how long the library has been actively maintained.
Using these libraries in React
Most of the libraries above offer React versions, wrappers or adapters. Ext JS is available in React through ReExt, which renders Ext JS grids, charts, forms and layouts as React elements. ReExt 1.2.0 supports Ext JS 8.0, and it lets React teams use the Ext JS data layer and components without leaving React.
Frequently asked questions
What is the best JavaScript data grid library?
For data-intensive enterprise application development, the Ext JS Grid is one of the most complete, with grouping, editing, locked columns, tree and pivot grids, and a built-in data layer. AG Grid is a strong standalone option, and Tabulator and TanStack Table are good free choices for simpler or highly custom needs.
What is the best JavaScript chart library?
It depends on the job. Ext JS Charts suits dashboards where charts must stay in sync with grids. Apache ECharts and Chart.js are strong free options, Highcharts is a supported commercial choice, and D3 is best for custom visualizations.
Which JavaScript library is best for building dashboards?
If a dashboard combines grids, charts, filters and layouts on the same screens, a framework where they share data and theme, such as Ext JS, saves the most integration work. Otherwise, combine a grid library, a chart library and a layout library such as Gridstack.js.
Are there free JavaScript libraries for data grids and charts?
Yes. Tabulator, TanStack Table, AG Grid Community, Apache ECharts, Chart.js, D3 and Gridstack.js are all open source. Advanced enterprise features, support and integrated suites are typically commercial.
Can I use Ext JS grids and charts in React?
Yes. ReExt brings Ext JS grids, charts, forms and layouts into React applications, and supports Ext JS 8.0.
One screen, one data source
The best JavaScript libraries for data grids, charts and dashboards depend on how they come together. For a single grid or a few charts, a focused library is often enough. For data-intensive applications, where grids, charts and filters share screens and data every day, the integration work between separate libraries quickly becomes the biggest cost.
Ext JS removes that cost by providing grids, charts, layouts and the data layer as one framework, and ReExt brings the same components to React teams.
Next steps: start a free Ext JS trial, explore the Ext JS Kitchen Sink, or read Best JavaScript Framework for Data-Intensive Applications.



Latest Content
JavaScript Libraries for Enterprise UI: Grid, Chart and Form Options Compared
Most comparisons of JavaScript libraries look at one category at a time: the best grid,…
November 12, 2026
Too Many JavaScript Libraries? How to Consolidate Your Front-End Stack
Every front end accumulates JavaScript libraries. A date library for one feature, a second one…
November 12, 2026

JavaScript Library vs Framework: Which Do Enterprise Apps Need?
“Should we use a JavaScript library or a framework?” sounds like a terminology question. For…
November 12, 2026