



 Ask Sencha AI
Debugging JavaScript Applications: Tools and Techniques for Faster Troubleshooting
May 27, 2026
1659 Views
Get a summary of this article:
Debugging is an unavoidable part of JavaScript development. No matter how experienced a developer is, bugs still happen: unexpected UI behavior, failed API requests, timing issues, incorrect state updates, rendering problems, and mysterious runtime errors. The difference between slow debugging and fast debugging usually comes down to having the right process, the right tools, and a solid understanding of how the application is structured.
In modern JavaScript applications, effective debugging is not just about fixing obvious syntax errors. It often involves tracing asynchronous flows, inspecting network requests, isolating data issues, understanding component lifecycles, analyzing stack traces, and identifying whether the problem lives in application code, framework behavior, or backend responses.
For Enterprise software development, this challenge grows quickly. Large interfaces, complex state management, data-heavy components, conditional logic, and layered architectures make bugs harder to locate. This is especially true in framework-driven environments like Ext JS, where applications use models, stores, controllers, view models, layouts, and component lifecycles that interact in sophisticated ways.
The good news is that debugging JavaScript can be made much faster with the right habits. Browser developer tools, breakpoint strategies, logging patterns, stack trace analysis, and framework-aware troubleshooting techniques all help reduce the time between seeing a bug and understanding its cause.
For Ext JS teams, additional tools and practices matter as well. Browser dev tools, Sencha Cmd, and Ext JS’s internal logging and diagnostics patterns can all help developers debug more efficiently and understand what is happening inside large applications.
In this guide, we will cover the most effective JavaScript debugging tools and techniques, then connect them to real-world Ext JS troubleshooting workflows.
Why Debugging Skill Matters
Debugging is not just a maintenance task. It is a core engineering skill.
Strong debugging ability helps developers:
- resolve issues faster
- reduce downtime and frustration
- understand unfamiliar codebases
- improve software quality
- avoid introducing secondary bugs
- diagnose root causes instead of masking symptoms
In large applications, debugging well often matters as much as writing new code.
A Better Way to Think About Debugging
Many developers lose time because they debug reactively. They see a symptom and start changing code randomly until the problem disappears.
A better approach is to debug systematically:
- reproduce the issue reliably
- narrow the location of failure
- inspect runtime state
- verify assumptions
- identify root cause
- apply a targeted fix
- confirm the bug is truly resolved
This method is faster and much safer than guessing.
Common Causes of JavaScript Bugs
Before discussing tools, it helps to know what kinds of problems you are usually looking for.
Common causes include:
- undefined or null values
- incorrect assumptions about data shape
- async timing issues
- stale state
- event handler conflicts
- logic errors in conditionals
- failed API responses
- DOM or component lifecycle misunderstandings
- type coercion surprises
- scope and closure issues
- framework configuration mistakes
In Ext JS applications, you may also encounter issues related to stores, bindings, layouts, component queries, proxies, controllers, and view model synchronization.
1. Browser Developer Tools
Browser developer tools are the first and most important debugging environment for JavaScript applications.
They help you inspect:
- console output
- runtime errors
- source files
- breakpoints
- call stacks
- network requests
- performance issues
- DOM changes
- memory usage
For most bugs, browser dev tools are where the investigation begins.
The Console
The console is often the fastest way to inspect runtime behavior.
Useful console methods include:
- console.log()
- console.warn()
- console.error()
- console.table()
- console.group()
- console.trace()
Example
    console.log('User data:', userData);
    console.table(records);
    console.trace('Function reached this point');
Good logging helps reveal what the application is actually doing, not what you assume it is doing.
Breakpoints
Breakpoints are one of the most effective debugging tools because they pause execution at a specific moment and let you inspect application state.
You can use breakpoints to examine:
- variable values
- scope contents
- call stack order
- control flow
- timing of execution
Types of useful breakpoints include:
- line-of-code breakpoints
- conditional breakpoints
- event listener breakpoints
- XHR or fetch breakpoints
- DOM mutation breakpoints
For complex bugs, breakpoints are usually better than excessive logging.
Watch Expressions
Watch expressions help you monitor specific variables or expressions while stepping through code.
This is especially useful when debugging nested conditions or changing state over time.
Call Stack Inspection
The call stack shows how the code arrived at the current point. This is essential when debugging deeply nested functions, event-driven logic, or framework-managed execution.
Instead of only asking, “What failed?”, ask:
“Who called this, and why was this code reached?”
That question often reveals the true source of the bug.
2. Network Panel Debugging
Many JavaScript bugs are actually data or API bugs.
The Network panel helps you inspect:
- outgoing requests
- request headers
- payloads
- query parameters
- response bodies
- status codes
- timing information
- failed requests
If data is missing, malformed, delayed, or rejected, the Network panel often reveals the cause quickly.
Common Checks
When debugging API-related issues, verify:
- the request was sent at all
- the correct endpoint was used
- parameters are correct
- authentication headers are present
- the server returned the expected structure
- error responses contain useful details
In Ext JS applications, this is especially useful when debugging store proxies, form submissions, remote filtering, and CRUD workflows.
Also Read: What Are UI Frameworks? Best JavaScript UI Frameworks for Enterprise Development in 2026
3. Source Maps and Readable Builds
Debugging minified or bundled JavaScript is painful without source maps.
Source maps allow browser dev tools to map built code back to original source files, making it much easier to:
- inspect real file names
- set meaningful breakpoints
- trace errors in original modules
- understand stack traces
In production-like environments, ensuring source maps are available for debugging can save significant time.
4. Logging Strategically
Logging is useful, but random logging creates noise.
Good logging should answer questions like:
- what function was called?
- with what inputs?
- what branch was taken?
- what request was sent?
- what value changed?
- what failed, and where?
Better Logging Pattern
    console.group('Save Operation');
    console.log('Payload:', payload);
    console.log('Validation passed:', isValid);
    console.log('Endpoint:', url);
    console.groupEnd();
Avoid
- logging everything everywhere
- vague messages like here or test
- leaving noisy debug output in long-lived code
- relying on logs when a breakpoint would be more effective
5. Reading Error Messages and Stack Traces Properly
A lot of debugging time is lost because developers skim errors instead of reading them carefully.
A typical JavaScript error can tell you:
- what went wrong
- where it happened
- which line triggered it
- what call path led there
Example Mindset
If you see:
TypeError: Cannot read properties of undefined
Do not stop at the message. Ask:
- which variable is undefined?
- why is it undefined here?
- was data not loaded yet?
- was a property renamed?
- did a previous function return the wrong shape?
The error message is the beginning of the investigation, not the end.
6. Debugging Async Code
Asynchronous behavior is a major source of JavaScript bugs.
Common async issues include:
- race conditions
- unhandled promise rejections
- callbacks firing later than expected
- UI rendering before data is ready
- state updates happening out of order
Helpful Techniques
- set breakpoints inside async handlers
- inspect promise results
- verify request timing in the Network panel
- log when async functions start and finish
- confirm whether multiple requests overlap unexpectedly
Example
    async function loadUser() {
      console.log('Starting user load');
      const response = await fetch('/api/user');
      const data = await response.json();
      console.log('User loaded:', data);
    }
In Ext JS, async issues often appear around store loads, Ajax requests, lazy rendering, and event sequencing.
7. Isolating the Problem
One of the fastest ways to debug is to reduce the size of the problem.
Try to isolate:
- the smallest reproducible case
- the exact user action that triggers the issue
- the specific component involved
- the data condition required
- whether the problem is front-end framework, backend, or framework-related
This is especially important in large Ext JS applications, where many subsystems may interact.
8. Verifying Assumptions
Many bugs survive because developers assume too much.
Examples of risky assumptions:
- “The store is loaded”
- “This handler only fires once”
- “The API always returns an array”
- “That field is never null”
- “The component is already rendered”
- “The record exists by the time this runs”
Debugging improves dramatically when you replace assumptions with inspection.
Debugging Ext JS Applications
Debugging Ext JS applications requires all the standard JavaScript techniques, but it also helps to understand how the framework organizes application behavior.
Ext JS applications may include:
- components and containers
- layouts
- controllers
- view models
- models and stores
- data bindings
- proxies and Ajax requests
- events and lifecycle hooks
This means a visible bug may come from several possible layers:
- bad data
- failed binding
- incorrect store configuration
- event timing
- layout issues
- controller logic
- framework usage mistakes
Understanding those layers helps you debug more precisely.
Browser Dev Tools in Ext JS Projects
Browser dev tools remain essential in Ext JS development.
They are especially useful for:
- inspecting Ajax requests from proxies and forms
- pausing in controller handlers
- tracing store loading behavior
- checking rendered DOM structure
- identifying layout or sizing issues
- reading stack traces from component interactions
If a grid is empty, for example, the issue may be in:
- the store not loading
- the proxy returning wrong data
- the model field mapping being incorrect
- the component binding failing
- the grid columns not matching the data
Dev tools help narrow that chain quickly.
Sencha Cmd and Build-Aware Debugging
In Ext JS environments, Sencha Cmd plays an important role in application builds, packaging, and deployment workflows.
This matters for debugging because some issues only appear in certain build modes, environments, or optimized outputs.
When debugging Ext JS applications, it helps to consider:
- whether the issue appears in development only
- whether it appears after a production build
- whether class loading or dependency ordering changed
- whether minification obscured stack traces
- whether build configuration affected included code
A bug that only appears in a built version may point to packaging, class inclusion, or environment-specific differences rather than ordinary runtime logic.
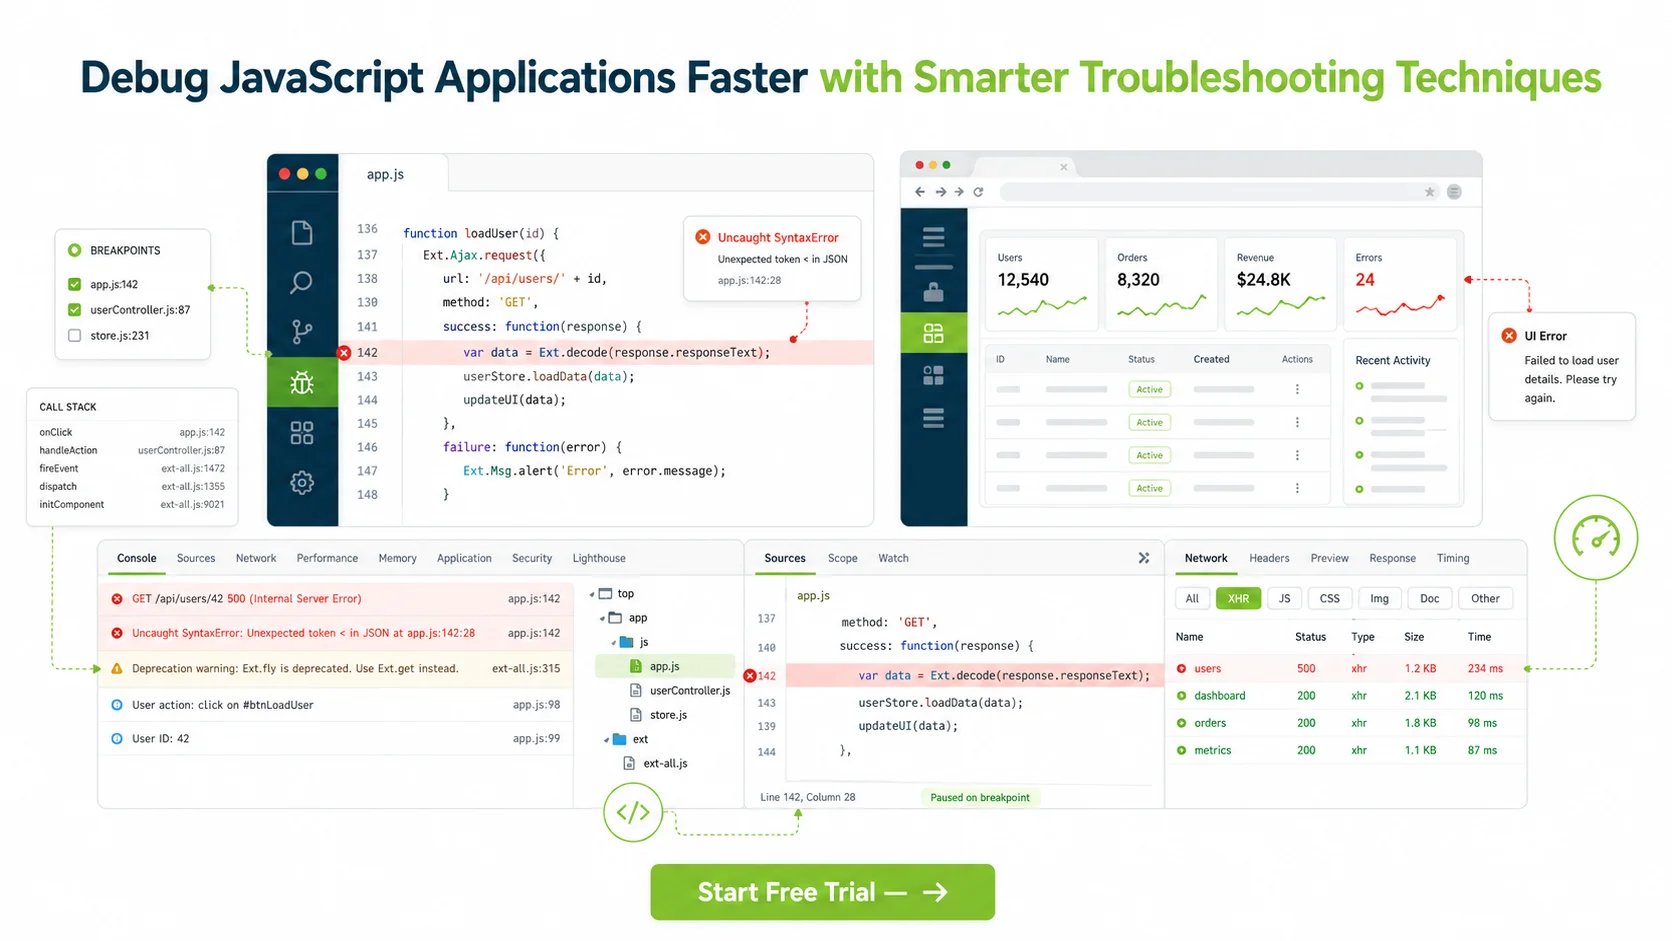
Understanding Ext JS Internal Logging and Diagnostics
Framework-aware logging can significantly improve troubleshooting.
In Ext JS applications, internal framework messages, warnings, and structured logging patterns can help reveal issues related to:
- invalid configs
- component lifecycle problems
- layout recalculations
- store and model behavior
- binding mismatches
- deprecated usage
- class loading problems
For teams working heavily in Ext JS, it is useful to establish clear logging practices around:
- store load events
- proxy responses
- validation failures
- controller actions
- component initialization
- key lifecycle transitions
The goal is not just to log more, but to log meaningful framework events that explain application state.
Practical Ext JS Debugging Workflow
Here is a practical workflow for debugging Ext JS applications faster:
1. Reproduce the issue consistently
Know exactly what action, data, or screen state causes the bug.
2. Identify the layer involved
Ask whether the issue is likely related to:
- component rendering
- layout
- controller logic
- store or model data
- proxy or Ajax response
- binding or view model behavior
3. Inspect browser console and network activity
Look for runtime errors, failed requests, or malformed data.
4. Set breakpoints in the relevant handlers
Pause inside controller methods, callbacks, or store events.
5. Verify data flow
Check:
- did the request happen?
- did the response arrive?
- did the store receive records?
- did the component bind correctly?
- did rendering occur as expected?
6. Check build and environment differences
If the bug appears only in certain builds, investigate the Sencha Cmd output and environment-specific behavior.
7. Apply a minimal fix and retest
Confirm both the symptom and the underlying cause are resolved.
Common Debugging Mistakes
Some of the most common mistakes include:
- changing code before reproducing the problem
- logging too much without a plan
- ignoring the network layer
- trusting assumptions instead of inspecting state
- fixing symptoms instead of root causes
- failing to test after the fix
- overlooking build-specific issues
- treating framework behavior as a black box
In Ext JS projects, another common mistake is debugging only the visible UI component and ignoring the related store, model, binding, or controller layers.
Tips for Faster Troubleshooting
To debug faster in any JavaScript project:
- reproduce before changing code
- use breakpoints more often
- read stack traces carefully
- inspect actual runtime data
- check network requests early
- isolate the smallest failing case
- test assumptions one by one
- keep logs structured and intentional
For Ext JS specifically:
- inspect stores and proxies first in data issues
- verify bindings and controller handlers
- compare dev and build behavior
- use framework-aware logging patterns
- understand the relevant lifecycle for the component involved
Conclusion
Debugging JavaScript Framework is not just about finding bugs. It is about understanding how your application behaves under real conditions and narrowing problems down quickly and accurately.
The most effective debugging techniques include using browser developer tools, setting breakpoints, reading stack traces carefully, inspecting network requests, and validating assumptions instead of guessing. These habits can dramatically reduce troubleshooting time and improve code quality.
For Ext JS applications, these same principles apply, but framework knowledge adds another layer of advantage. Understanding components, stores, models, bindings, proxies, and lifecycle behavior makes it easier to identify the real source of a problem. Tools such as browser dev tools, Sencha Cmd, and Ext JS internal logging practices help developers troubleshoot large enterprise applications more effectively.
The faster you can move from symptom to root cause, the more productive and confident you become as a JavaScript developer.
Start your free Ext JS trial and build enterprise-grade apps faster.
FAQs
What is the best way to debug JavaScript applications?
The best approach is usually a combination of browser developer tools, breakpoints, structured logging, stack trace analysis, and systematic isolation of the bug.
Why are breakpoints better than excessive logging?
Breakpoints let you pause execution and inspect exact runtime state, scope, and call flow, which is often more precise than adding many log statements.
How do I debug API-related JavaScript issues?
Use the browser Network panel to inspect requests, headers, payloads, status codes, and response bodies.
Why are source maps important?
Source maps let you debug original source files instead of minified or bundled output, making breakpoints and stack traces far easier to understand.
What makes debugging Ext JS applications different?
Ext JS applications often involve components, stores, models, controllers, bindings, and layouts, so bugs may come from multiple framework layers rather than a single script.
How does Sencha Cmd help with debugging?
Sencha Cmd helps developers understand build-related behavior, environment differences, and issues that appear only in packaged or optimized versions of Ext JS applications.
What should I check first when an Ext JS grid is empty?
Check whether the store loaded successfully, whether the proxy returned the expected data, whether model mappings are correct, and whether the grid is properly bound to the store.
Debugging & Troubleshooting
JavaScript Development
Enterprise Application Development
Frontend Development
Software Development Tools
Web Application Development
 0
0
 0
0
Latest Content
React Component Library for Data-Heavy Apps: Why 1 Vendor Beats 5
Data-heavy React apps rarely start with five UI vendors. They get there one reasonable decision…
October 21, 2026
How to Standardize on One UI Component Library Across Your React Apps
In most large organizations, every React app has its own UI stack. One team uses…
October 21, 2026
UI Component Library vs Component Framework: What Enterprise React Teams Need
Ask a React team what they use for UI, and you’ll usually hear the name…
October 21, 2026